RamRisk User Manual
RamRisk
Welcome to RamRisk's documentation
RamRisk User Manual
Version October 2024
Rambøll
Hannemanns Allé 53
DK-2300 København S
T +45 5161 1000
F +45 5161 1001
www.ramboll.dk
For further information, please contact support@ramrisk.com
The newest version of this manual can be downloaded from ramrisk.com
Introduction
RamRisk is a web-based risk register developed by Ramboll. With RamRisk it is possible to identify, evaluate and handle risks, positive (opportunities) as well as negative (threats), in accordance with ISO 31000 “Risk Management – Principles and Guidelines” and the risk management standards like it.
RamRisk supports the risk management process by providing the functionalities:
- Risk description in terms of risk, cause and effect, status and owner.
- Risk categorisation using tags.
- Risk evaluation using risk matrices and explicit assessment of frequencies and consequences (using triple point estimates)
- Control and actions with deadline, status and responsible.
- References between risks, controls and actions (in the same project).
- References between risks, controls and actions (across projects, extension).
- References to all external material (e.g. links to files, webpages)
- Confidentiality allowing certain risks to be visible to only a selection of users.
- Full log of the register through track changes (full documented traceability).
- Report module for producing risk lists and various statistics.
- Overview module to get an overview of the present status of a project and on a group of projects
- Mail subscriptions with approaching deadlines, changes etc.
With its flexible design RamRisk enables the setup of a tailored risk register meeting the needs of various project types and sizes.
The interface of RamRisk may appear slightly differently depending on the browser.
Requirements
The following is required to use RamRisk:
- Any modern browser (If you use Internet Explorer you will have to use version 10.0 or later.)
- JavaScript must be enabled
- MS Office 2007 or newer for reporting
- An internet connection – preferably 2 Mbit or better
- Minimum screen resolution of 1024 x 768
Online Help
The newest version of this manual is available for download from ramrisk.com. Here you can also find quick guides for download.
Getting started
This section gives you a general introduction to the topics:
- Log in
- Request a new password
- The RamRisk User Interface
Log In
Once you have been created as a user in RamRisk by an administrator, you will receive an email with information on how to get access to RamRisk, see this figure.
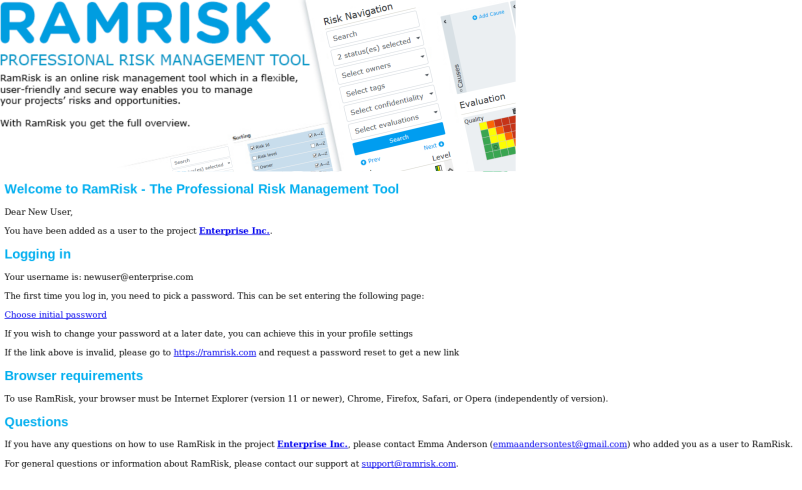
By clicking the link Choose initial password in the email, your browser will direct you to a page on www.ramrisk.com, shown in this figure. Here you set your initial password.
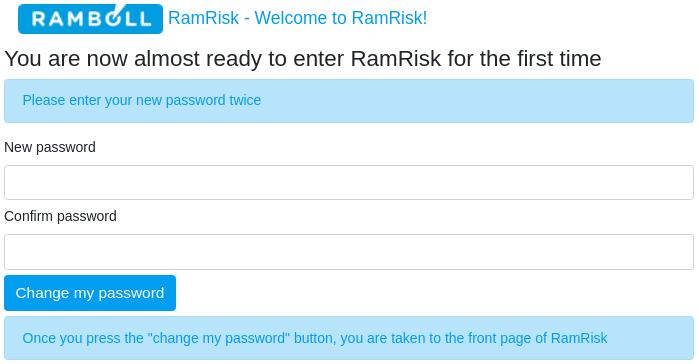
Once you have entered a password you will be logged into ramrisk.com.

Single-Sign-on
It is also possible to use your Microsoft Account to sign-in to RamRisk.
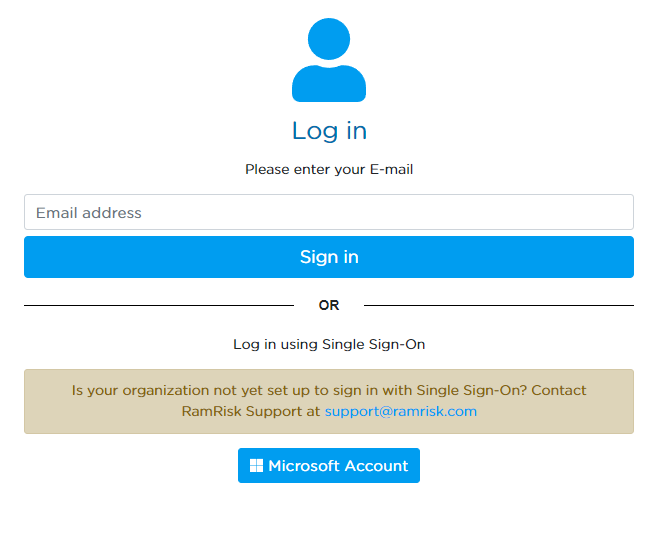
By navigating to the login page, at the bottom of the Log-In form you will be presented with the option to Log-in using Microsoft Account.
Please keep in mind that Microsoft login needs to be setup for your organisation beforehand. Please reach out to support@ramrisk.com to get started.
Please also note that Multi-Factor Authentication settings in RamRisk do not apply to users who sign in with SSO, since all the authentication concerns are offset to the SSO provider.
Request a New Password
You can change your password directly in RamRisk under your profile. In case you forget your password, you can always request a new password directly on ramrisk.com. There is no expiration date on your password.
Take a guided tour
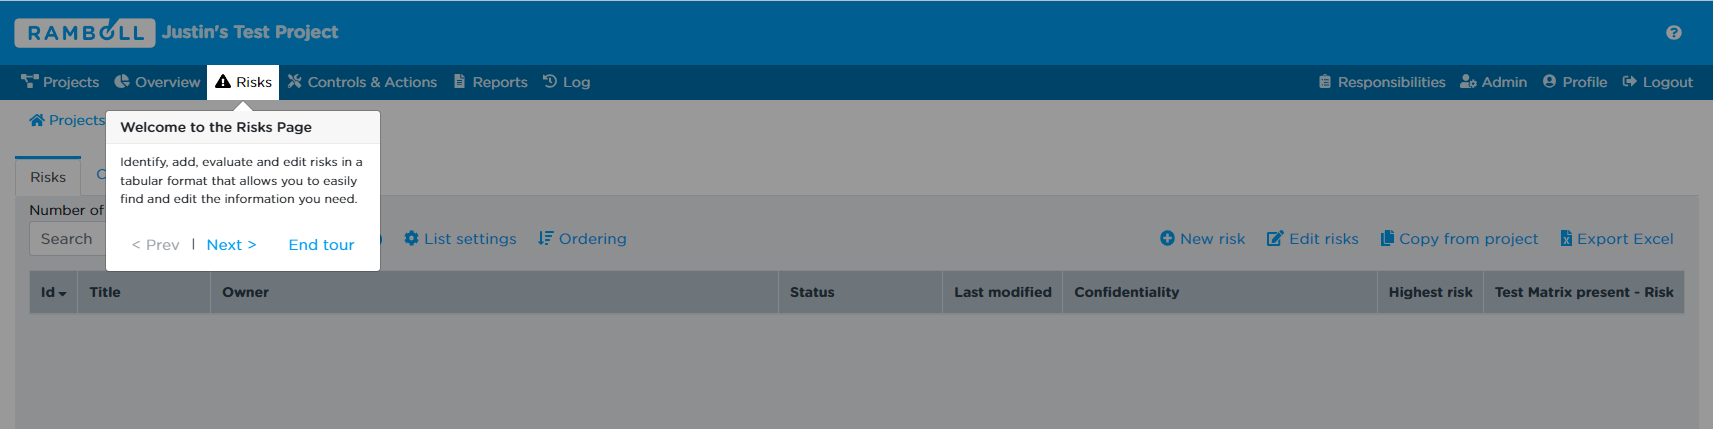
When first logging in to your RamRisk account, you will be offered a guided tour through the user interface which will highlight the features and how to use them.
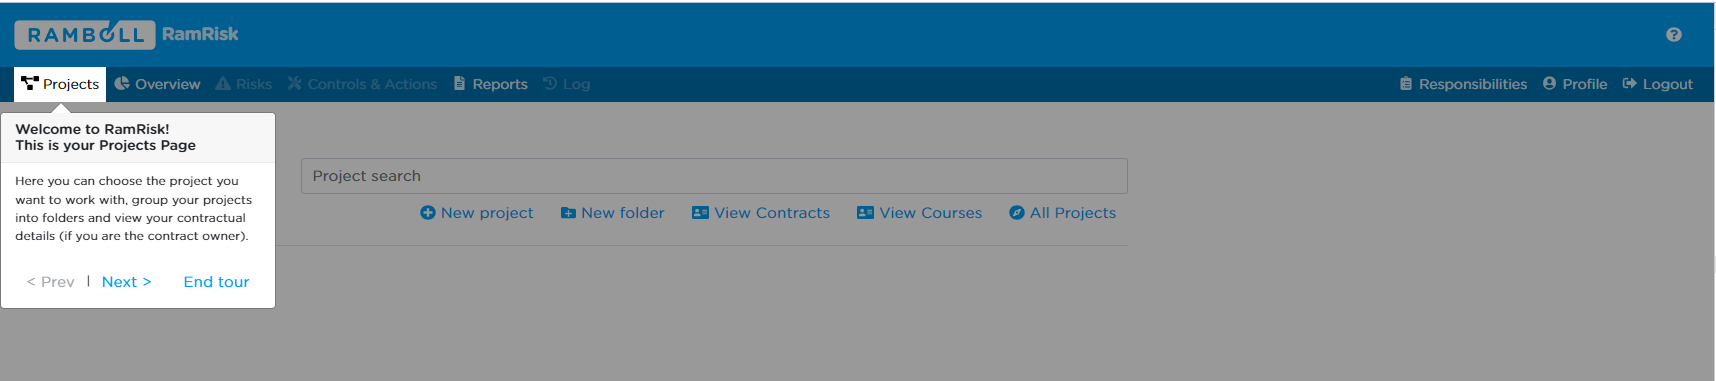
Clicking on the "Next" button will show the next step of the tour. If you want to end the tour for now you can click the "End tour" button.
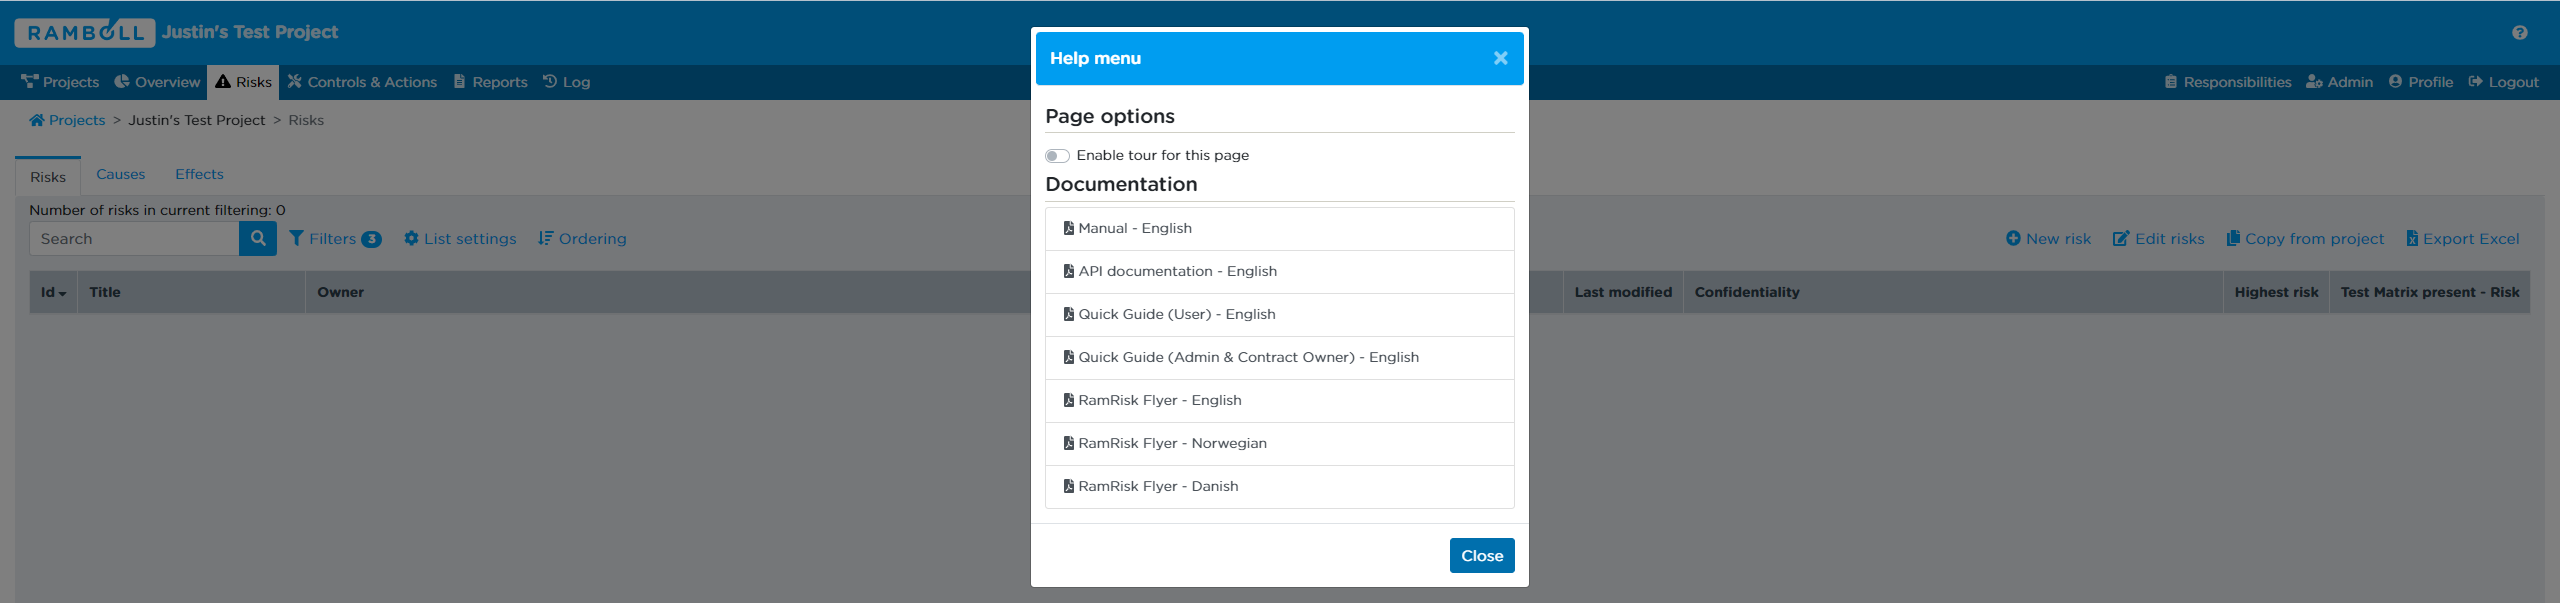
If at any point you want to retake the tour, clicking the "Question mark" button, in the upper-right corner of the interface will bring up the help menu. There you can restart the tour by clicking on the "Enable tour for this page" radio button, and closing the help menu.
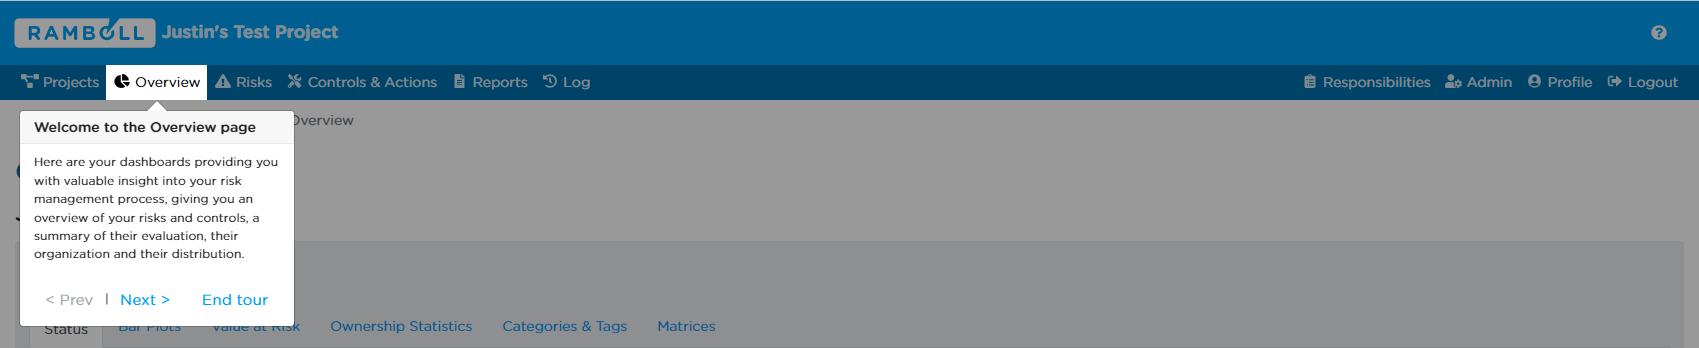
Each page has a separate tour which could provide valuable details on how to use the RamRisk solution, remember to check on each page for the individual tour guide.
The RamRisk User Interface
The RamRisk user interface consists of two main parts as shown in this figure and described in the table below.
The main user interface
Main Menu
The main menu contains links to all main views of RamRisk. The available menu items change according to which view, you are currently in.

In general, the following menu items are available:
- “Projects””: A list of the current user's projects (see The Projects Page)
- “Overview”: Page giving an overview with different statistics (see The Overview Page)
- “Reports”: Setup of reports (see The Reports Page)
- “Responsibilities”: View of responsibilities (see The Responsibilities Page)
- “Profile”: Setup personal profile (see The Profile Page)
- “Logout”: Logging out of RamRisk
For the currently selected project:
- “Overview”: Page giving an overview with different statistics (see The Overview Page)
- “Risks”: Listing of risks (see The Risks Page)
- “Controls”: Listing of controls (see The Controls Page)
- “Actions”: Listing of actions (see The Actions Page)
- “Reports”: Setup of reports (see The Reports Page)
- “Log”: Access to a log of all changes to risks, controls, etc. (see The Log Page)
- “Responsibilities”: View of responsibilities (see The Responsibities Page)
- “Admin”: Setup of the project (see The Admin page) – only available to project administrators.
- “Profile”: Setup personal profile (see The Profile Page)
- “Logout”: Logging out of RamRisk
Main Contents
This part of the screen displays the view chosen in the main menu (Area 1).
Icons
Across RamRisk, you will see different icons. Here is an overview of the most used icons:
 Add object (risk, control, action, etc)
 Edit object (risk, control, action, etc)
 Export data to Microsoft Excel file
The Profile Page
This section gives you a general introduction to the topics:
- Changing your personal information and password
- Change language of the user interface and language to be used in reporting
- Change time zone
- Setting up multi-factor authentication
- Setting up email subscriptions
Your Profile page is accessed by clicking “PROFILE” in the right side of the top menu.
Changing Your Personal Information and Password
On your Profile page you can update your personal information and change your password, see Personal Info.
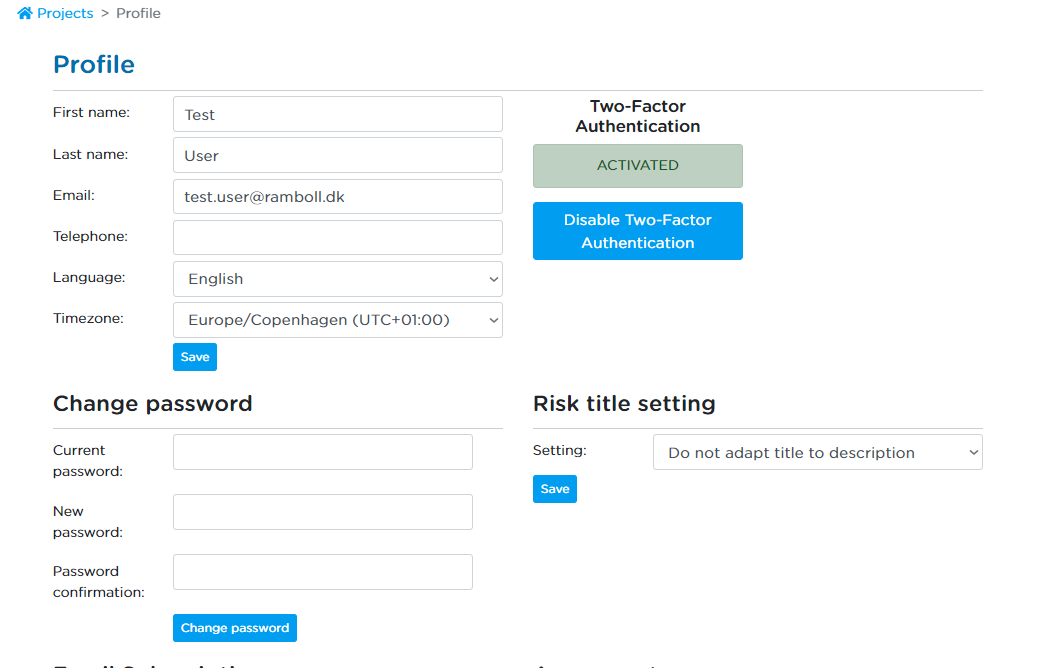
To change your password, type in your current password in the textbox labelled “Current password” and then type and re-type in the new password in the following two textboxes. Note, RamRisk does not require you to update your password, ever.
The length of the password must be at least 6 characters. In case you have forgotten your password, you can request a new one from the login page.
On the Profile page you can set you preferred language of the user interface – default is English. You also have the option of adapting RamRisk to your time zone. All time readouts in RamRisk will automatically adjust to reflect your time zone setting.
Setting up Multi-Factor Authentication
Optionally you can turn on multi-factor authentication for your RamRisk account. Multi-factor authentication means that RamRisk will require to verify your identify through a second method in addition to the password at the time you log in.
You can activate this additional verification using the “Enable Multi-Factor
Authentication” button on this page. When you click this a QR code will be
displayed on the page. In order to complete activating the multi-factor
authentication you need to link your personal device (e.g., smartphone) to
RamRisk using the displayed QR code. In order to do this a special authenticator
app needs to be installed through the app store of your device.
The RamRisk QR code will work with most authenticator apps that are currently available. We primarily support Google Authenticator, but other authenticator apps can be used as well as long as they have an option to scan the displayed QR code linking them to RamRisk.
Having the multi-factor authentication activated means that next time you log in you will be asked to provide the code displayed inside the authenticator app on your device.
While multi-factor authentication is optional, some organizations using RamRisk might make this a mandatory requirement. If you are accessing RamRisk through an organization that has this mandatory requirement you will be required to activate it before you are able to access the system.
Setting up Email Subscriptions
After the sections “Profile” and the “Change Password” follows the section of setting up mail subscriptions. This section contains a list of every project you are affiliated with. Several checkboxes appear when clicking a specific project; see Email Subscription where the project “Enterprise Inc” has been expanded.
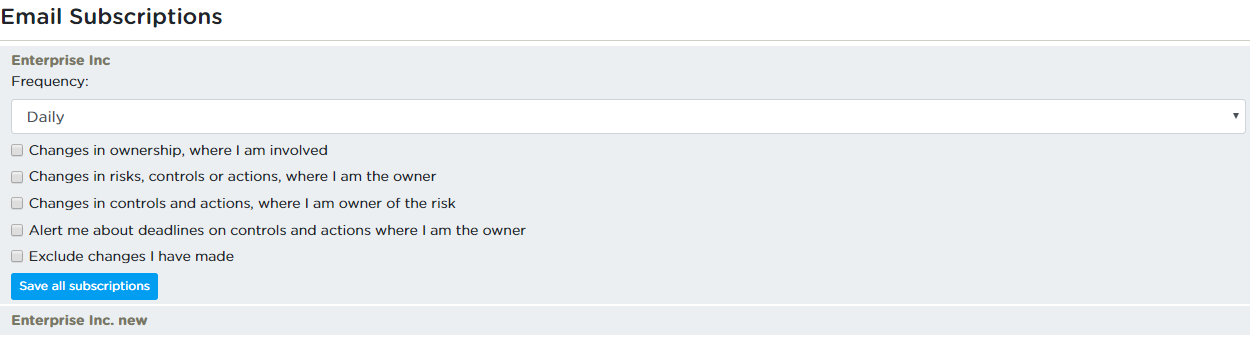
Here you can specify:
- The frequency with which you want to receive updates by email. You can select either daily, once a week, every second week, once a month or every third month. You will only receive mails if there are changes to the system.
- What information you are interested in; e.g. email updates when risks, controls or actions you are responsible for are changed.
- Regardless of the frequency, you can select to have RamRisk send email alerts two weeks before, on the deadline and two weeks after.
- For all subscriptions, you can exclude changes made by you (such that you do not receive emails including information on the changes you have done yourself)
A specific setup must be made for each project, you are participating in.
Setting up your personal configuration
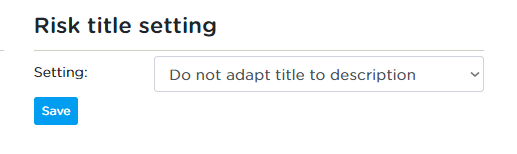
For a fine grained control on how the Risk items title is set, you can specify in the Profile settings section, which policy you prefer for your own account, to be use when creating a new risk or updating the description of the risk.
Your options are:
- Don't update the title to reflect the description
- Always update the title to reflect the description
- Ask what to do when the description changes
The Projects Page
This section gives you a general introduction to the topics:
- Entering a project
- Organising your projects in folder and subfolders
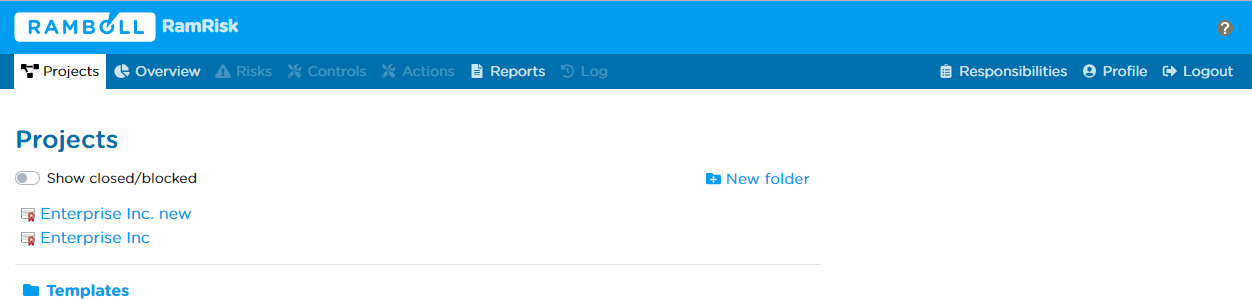
The Projects page is the first page you see when you log in to RamRisk.
Entering a Project
The Project page shows the list of projects you are affiliated with, see this figure. If you wish to view a closed or blocked project, then click the switch (turned off by default). Clicking the name of a project takes you to Risk page of the project, and by default the complete list of risks defined for the project is shown, see The Risks Page.
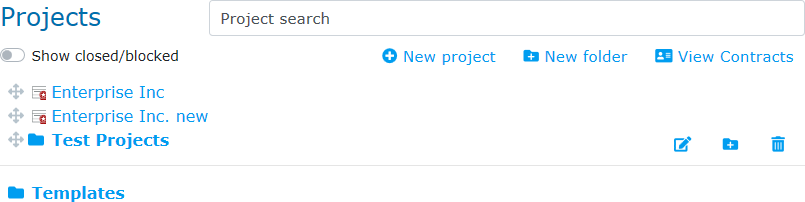
Your projects can be organised in folders and folders can be put into others folder and become subfolders. In this way it is easy to organise your projects in a personal folder structure. A folder is created by clicking the “Add new folder”-button. A dialog box asks for the name of the folder before it can be created. Projects as well as folders can be dragged and dropped into other folders. Just use the handle next to the folder/project icon. For users having access to the Enterprise module the Overview can show consolidated information for all projects in a folder and its subfolders and the Report module can also use these folders to generate reports across projects. For more information see Overview Across Projects. Projects and folder can be filtered by the “Project search” bar. It will filter as you type.
The Risks Page
This section gives you a general introduction to the topics:
- Risk List view
- Risk Filter
- Risk List
- Sorting
- List Settings
- Detailed Risk view
- Compact Filtered Risk List
- Log (automatic log)
- Risk Description
- Risk Evaluation
- Controls and Actions
- Tags
- Confidentiality (only admin)
- Comments
The Risk List view and the Detailed Risk view are the two views available through the Risks page, displaying, respectively, all the risks in the project and all the details of one specific risk.
The Risks page is entered by default when selecting a project from the Projects page described in previous section. Once a project is selected, you will always be able to return to the Risks Page by clicking “RISKS” in the top menu.
Risk List View
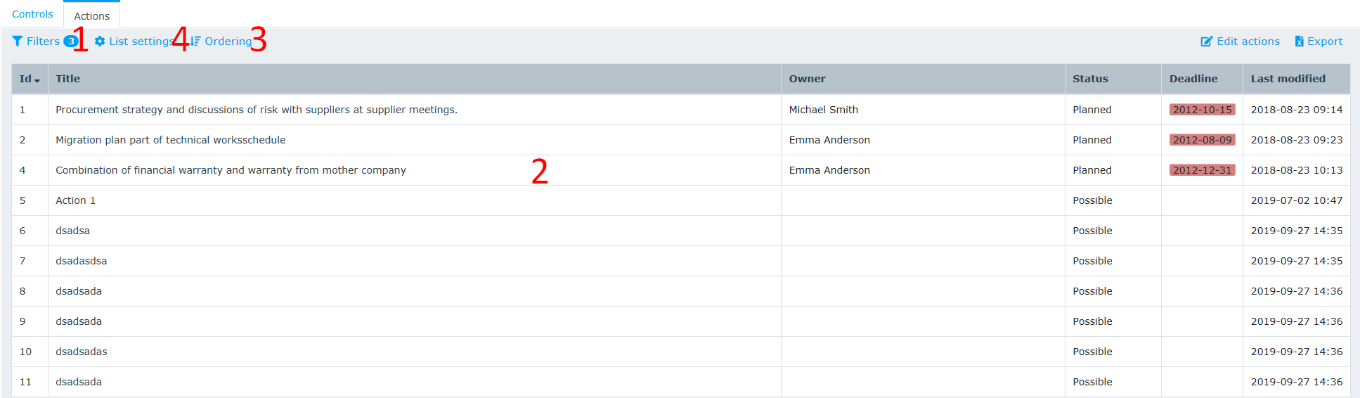
The Risk List view consists of four elements: 1) The Risk Filter, 2) The Risk List, i.e. the list of risks identified in the project, 3) Sorting menu and 4) the List Settings menu. See Risk List and the description in the table below.
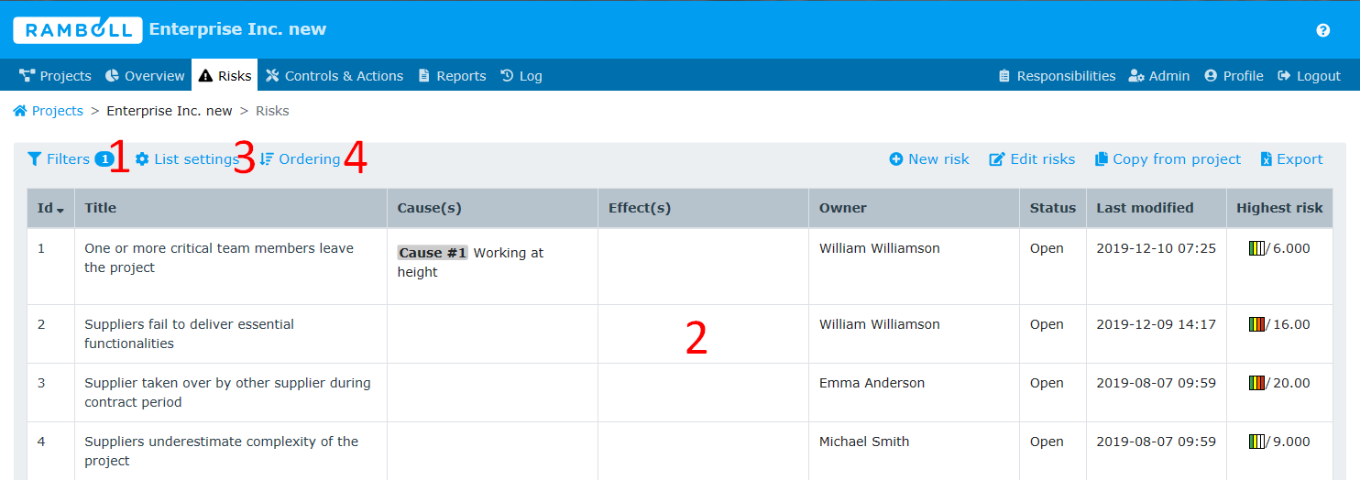
The Risk List view.
Description of areas in this figure.
Risk Filter
The Risk Filter gives various options for filtering and searching the list of risks:
- Free text search: Display risks where the given search string appears in the description of cause, risk or effect for a given risk. You can also use the free text search to search directly for risk numbers. For example, a search for the text “2” (leave out the quotation marks) will return risk with id 2. You can search for multiple risks by adding a comma between the numbers, e.g. “2, 4” will return the risks numbered 2 and 4 (again leave out the quotation marks). More complicated filters can be used as well, e.g. “2-4” gives the list with risks “2, 3, 4”, “-4” gives the list with “1, 2, 3, 4” and “10-” gives the list with risks “10, 11, 12, ...”.
- Status: Display risks with status “New”, “Open”, “Closed”, “Discarded”, or any combination (union).
- Owner: Display the risks owned by one or more users in the project. Furthermore, it is possible to search for risks where ownership has not been assigned.
- Tags: A list of categorized tags defined for the project can be checked such that the risk list only contains the risks for which the given tags are assigned. Note that the search engine uses “OR” between tags in the same category, and “AND” between tags from different categories.
- Confidential: Display risks according to confidentiality. The confidentiality of a given risk restricts the visibility of the risk to only users of selected user groups. Only a project administrator can change the confidentiality settings of a risk. By default, a risk is visible to all user groups.
- Evaluations: Display risks for which certain risk targets have been evaluated.
The Risk List is updated by clicking the “Search” button.
Note that the default filter selects all new and open risks. This entails, that risks with status “Closed” or “Discarded” are not displayed in the default filter.
Note that only fields that are being used will be present in the filter options, e.g. if only one risk owner is assigned to risks, only this user will be shown in the options.
Tip: Since RamRisk is a web application, it is possible to “save” your own filter(s) by bookmarking the result of a search in your browser.
Risk List
The list of risks reflects the choices in the Risk Filter, and it can be sorted in ascending and descending order by clicking any of the column headers: “ID”, “Title”, “Owner”, “Status”, “Last modified” or “Level”. A small arrow indicates the current sorting criterion and ordering. Note that you may have different columns in case you have changed the settings of the Risk List view, either directly from the list (see bullet number 4 below) or under your profile, see The Profile Page.
The “Level“-column consists of “potentiometers” with up to four levels (colours), corresponding to the colours specified in the risk matrices in the project. Normally, the potentiometer has the three levels green, yellow and red. The level of the potentiometer is determined by the highest risk evaluation of the risk in question.
From the Risk List view, you can go to the Detailed Risk view for a specific risk by clicking any of the shown risks either on the id or on the title/description. The Detailed Risk view is described in The Risks Page.
The four buttons above the Risk List have the following functions:
-
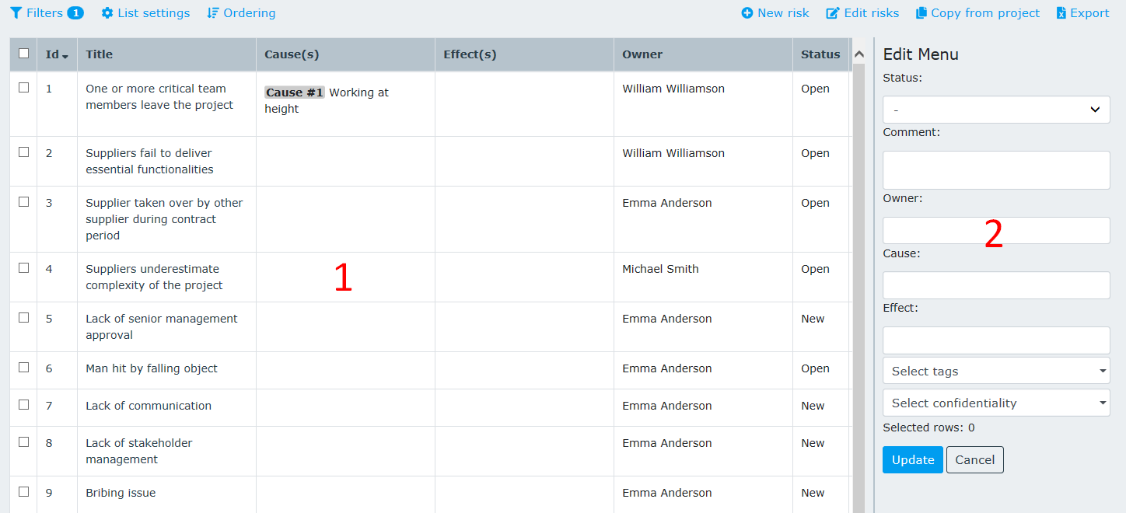
“Edit risks”: Enable/Disable bulk edit risks.
When clicking the button, the page will turn into the interface displayed in Edit Risks.
-
The interface consists of two sections:
1) The list with risks and a checkbox next to each risk. The checkbox next to Id, can be used as check/uncheck all risks. The Edit Menu will update according to which risks are selected. 2) Edit menu will provide components to perform the bulk edit. When changes are made, click “Update” to apply the changes or cancel clicking the “Cancel” button.
When you make changes and push the Update button on the Edit Menu, the changes will be applied to every item that has a checked box in the list. This gives you a quick way of reassigning ownership, applying tags, adding comments, or changing status of many items at the same time, rather than having to update them individually. The fields in the Edit Menu are updated dynamically depending on the rows you select.
-
“Editable Cells”: When hovering cells in a row, editable cells will show a pencil icon. Click the cell and change a single value for that specific risk. When you click outside of the cell, data is automatically saved.
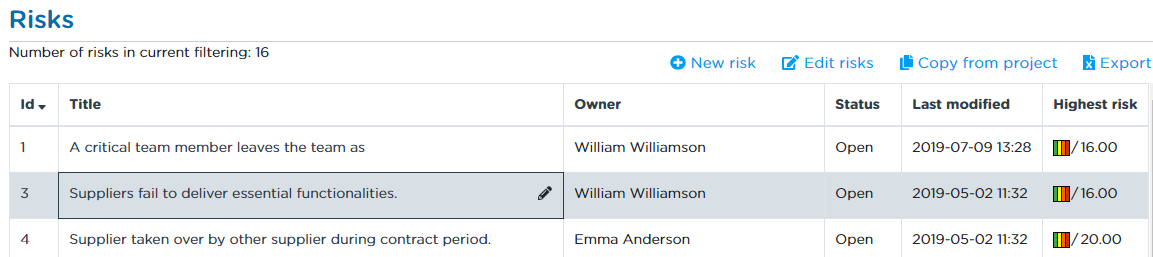
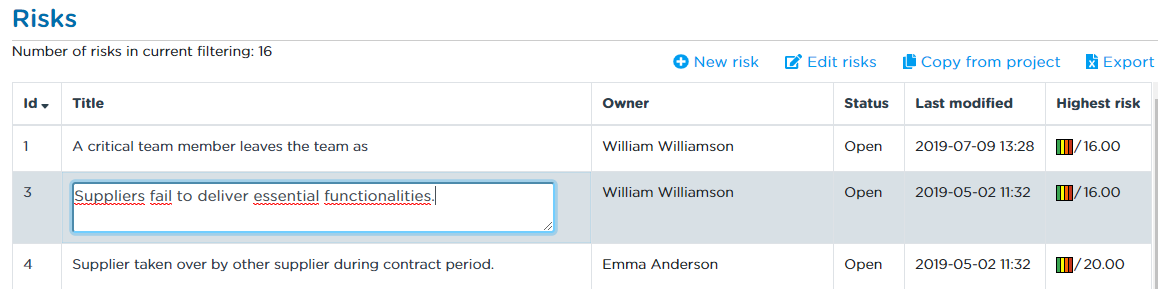
When a cell is in edit mode, there are different cell-types.
- “Text boxes” (title, risk - description, notes): enter text that is automatically saved when you leave the cell.
- “Auto complete” (cause, effect, risk relations): search for already existing causes/effects/risks and add them or remove already attached causes/effects/risks with a click on the trash can icon.
- “Select boxes” (owner, status): simply select a new value to change the value of the cell.
- “Check boxes” (confidentiality, tags: add and/or remove confidentiality groups and tags, by checking or unchecking the boxes.
- “Date picker” (deadline): change a deadline with a click in the calendar.
- “Copy from project”: Copy risks, control and/or actions from another project you are associated with. When clicking the button, you will be directed to the interface displayed in Figure - Copy from project.
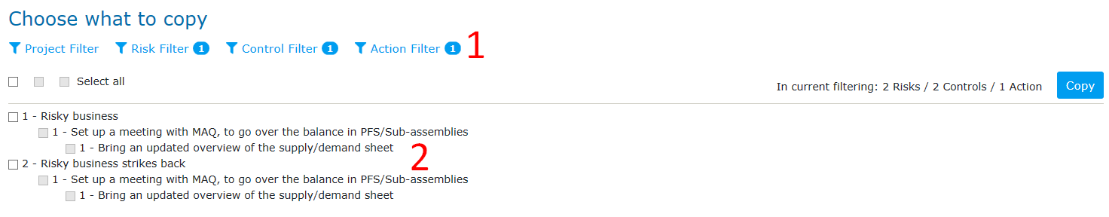
This interface consists of two sections:
1) A filter section where you can specify which project you are interested in copying from. Furthermore, you can filter the risks, controls and actions of the specific project by using the respective filters. The filters will dropdown if clicked. If a filter has active filters in given section, it is indicated with a counter. 2) A combined list of risks, controls and actions that meets the criteria specified in the filters. You can manually select the risks, controls or actions to be copied by clicking the checkbox in front of the relevant objects. At the top of the list you have the possibility to select all risks, controls or actions in the list.
To “uncheck” the checkboxes of the controls, you must select the risk connected to the control. This is also the case for actions connected to a control. In this way, you cannot copy a control without also copying the risk to which it belongs.
In order to copy the selected objects, click on the “Copy from project"-button at the top right corner. Depending on the number of selected objects this process can take some time.
Note that only the descriptions of the selected risks, controls and actions are copied along with causes, effects, and tags. Any project specific information (like the risk owner, the risk evaluations, the deadlines and the comments) is not copied.
- “Add risk”: Enter the Detailed Risk view of a new, unsaved risk to be added to the register, see The Risks Page.
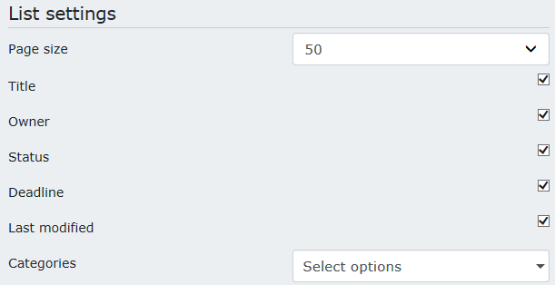
List Settings
- List Settings control which columns to show or hide in the Risk List. It is still possible to edit these settings from the profile page.
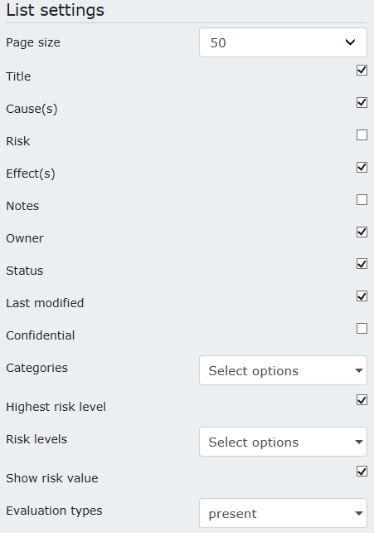
When a column is shown/hidden, it will update the page right away.
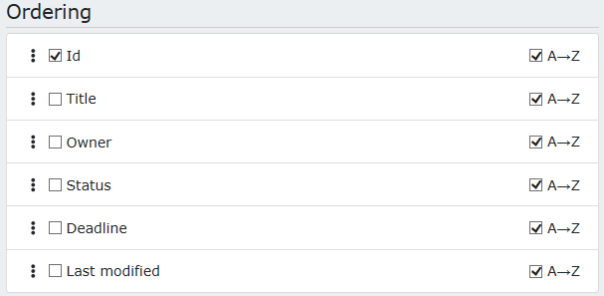
Sorting
- The Sorting section supports ordering by multiple columns. Check/uncheck multiple sorting boxes and they will all affect the ordering of the list.
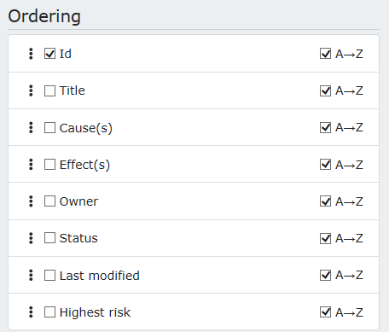
- Change the ordering of sort elements. Sorting directives can be re-arranged. just drag and drop the elements.
- Ascending or descending ordering is controlled by checking/unchecking the A→Z boxes.
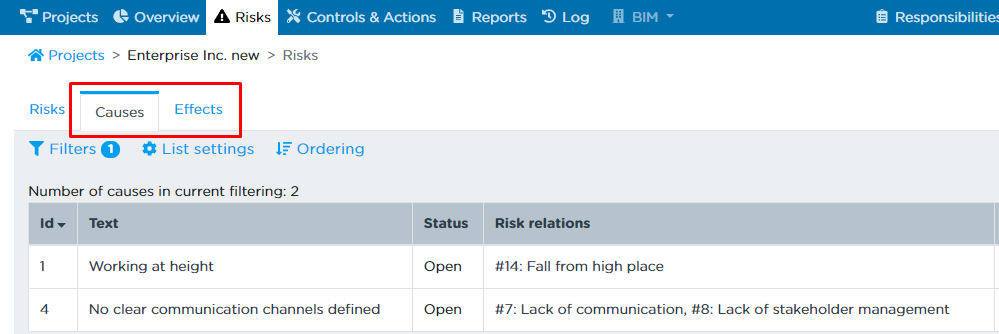
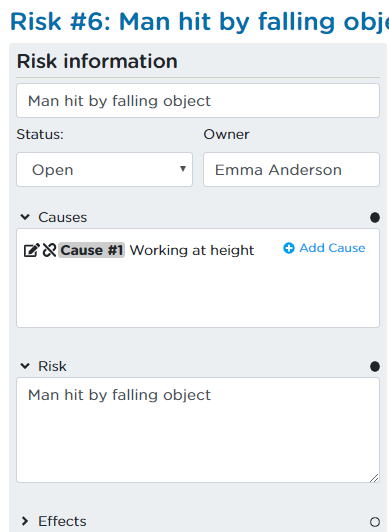
Causes/Effects Lists
When a risk is specified for a project, a series of causes or effects can be specified. These help better describe the conditions or circumstances for a risk, or the various consequences of a risk for the project.
Each risk can have one or more causes and effects assigned. Also risks can share causes and effects. The Causes List and Effects List provides a clear overview of all causes or effects in the project and how they relate to various risks.
It is also possible to create causes and effects as unattached items — that is, without linking them to any specific risk. Unattached causalities appear in the Causes/Effects List and can be attached to one or more risks later. This is useful when causes or effects are known but the associated risk has not yet been identified or created.
Unattached causes and effects are shown in the list by default. They can be filtered out using the "Show unattached" option in the filter.
Detailed Risk View
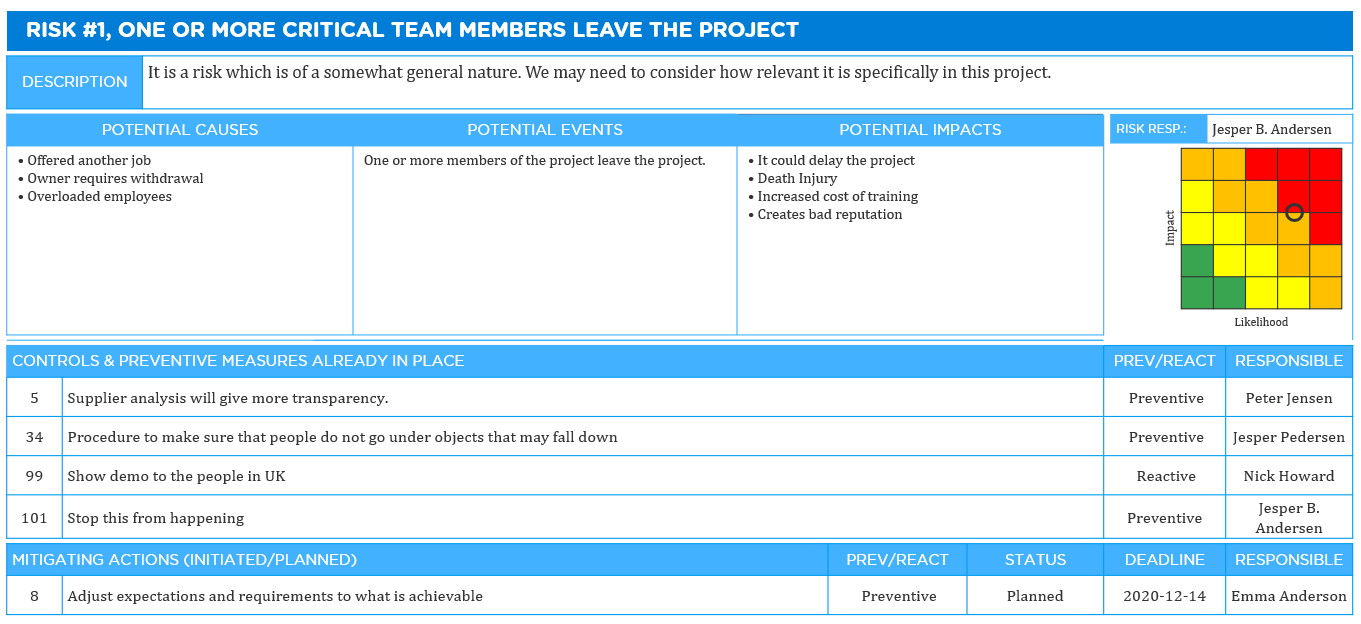
This view shows all information related to a given risk. The view consists of several areas as shown in Figure - detailed risk view and described in the table below.
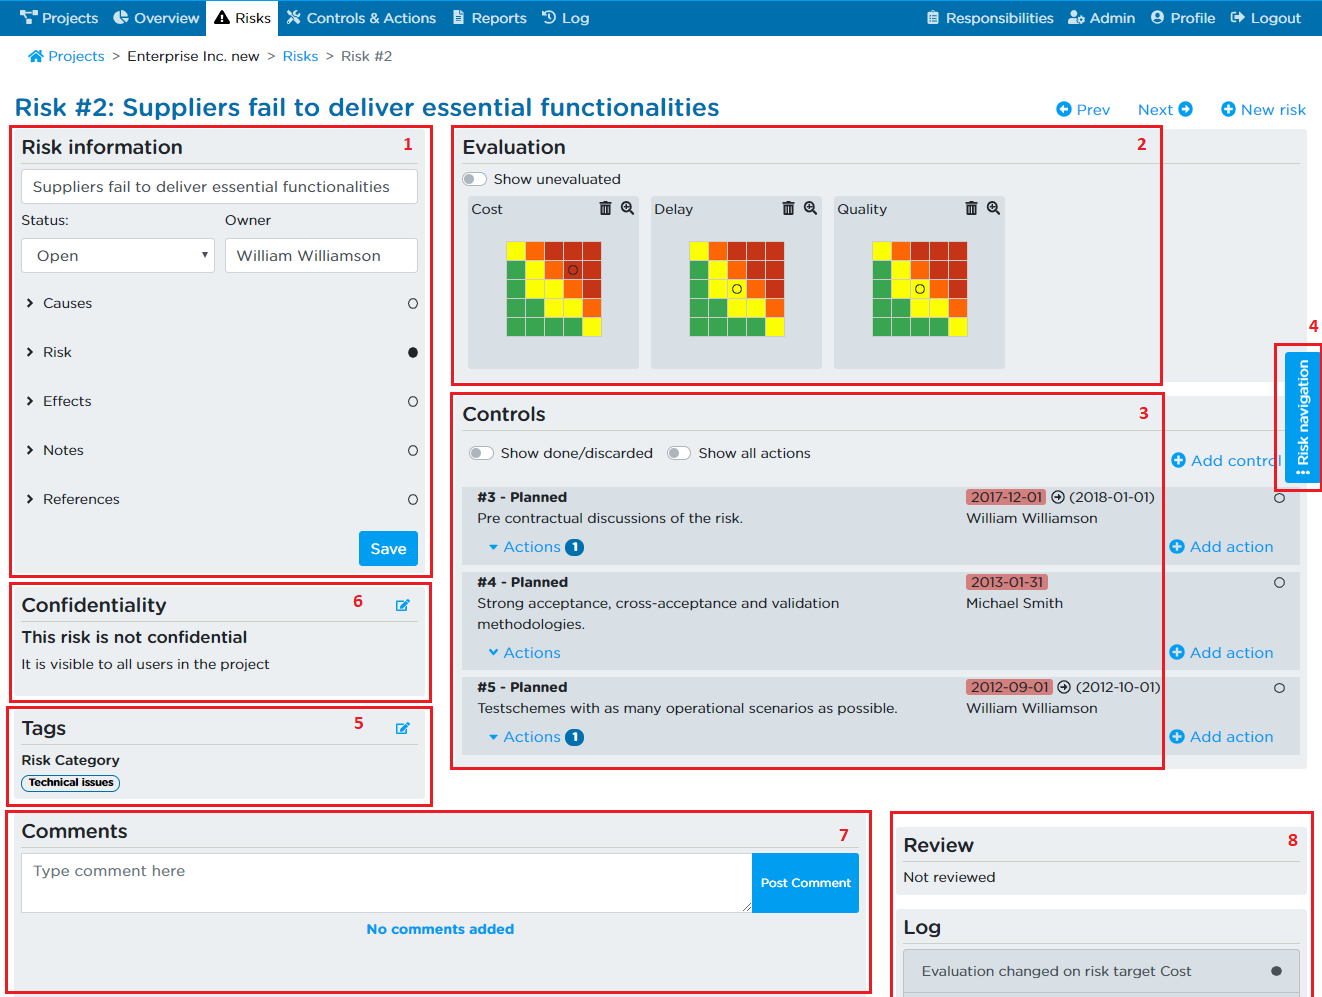
Risk Information
This area contains the description of the risk in terms of title, risk, cause and effect as well as owner and status.
The risk title is shown in the top. It is possible to edit the title by placing the cursor in the title. If no title is entered, the title will automatically be a copy of the first phrase of the risk description.
Below the risk title, it is possible to select the risk status and the risk owner. The status may be selected in a dropdown menu as “New“, “Open“, “Closed“ or “Discarded“. The risk owner is chosen by placing the cursor in the owner field and selecting the appropriate user in the resulting dropdown menu, see Figure - Risk owner field. The risk owner field is equipped with a search-functionality which enables you to type in the name of the risk owner and shorten the list as you type.
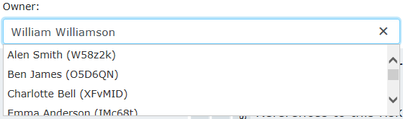
It is possible to assign the ownership of the risk to a person who is not yet a user of the project by clicking “Add user ...“, see "Figure - Risk owner inactive". Note that this functionality is only available, if the total number of users allowed on the project is not exceeded.
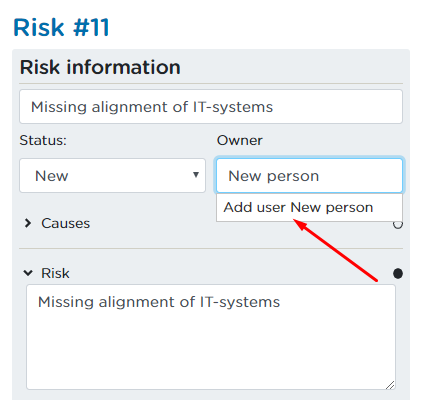
Creating a new entry will result in the addition of an “inactive user“. An “inactive user” is a reference in the system, to which ownership and responsibility can be assigned without creating a user at once. The “inactive user” can later be converted to a real user by a project administrator.
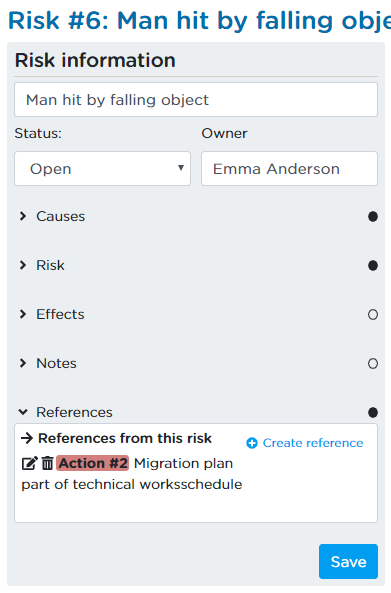
Below the title, status and owner, is displayed the main description of the risk divided into the five areas: “Cause(s)“, “Risk“, “Effect(s)”, “Notes” and “References”. Each of these can be opened and closed independently of each other, meaning that e.g. cause, risk and effect can be open at the same time, while the rest are closed and hidden away. Just click on the title areas to open the parts you want to see, and similarly collapse them again. Your choice will be remembered going to different risks or projects.
A filled circle (•) on a tab indicates that the area contains information, and an empty circle indicates that the field does not contain any information. In this way you can easily see if the collapsed area contains information. Note that unlike the “Comments” in area 8, the “Notes” can be printed in reports.
Causes and effects are objects just like risks, controls and actions and can be re-used across multiple risks.
Cause and effect will respect confidentiality, if being used in that context.
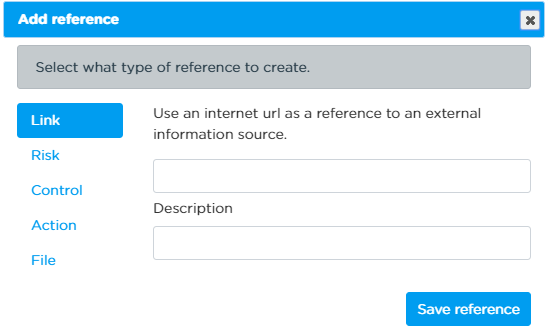
“References” is a feature that allows you to link to another risk, a control, an action, a file or an external document, a website, SharePoint item or anything else with an URL or a file path. This allows you to work with sub-risks, to aggregate risks from project level to portfolio level or to refer to a mitigation norm or reference system.
When clicking “Create reference” a popup will show, and you can choose to reference to a link or a risk, control or action in RamRisk.
References can be used for many purposes, e.g.:
- Linking to detailed description or documentation related to a risk
- Linking to detailed information for a given control/action e.g. to a procedure or standards
- Linking between risks to indicate that they are related (with the Enterprise Module you can even link between risks in different projects)
- Link between e.g. different controls (if they are related)
Note that if your make a reference to another object in RamRisk, the relation will also be shown under “References” in the referenced object.
The references are clickable links, so it is easy to go to another referenced object.
Note that the option to link between risks and other elements between projects is not a standard feature in RamRisk. It is only enabled if your contract includes the Enterprise Module. If you are interested in including this feature into your contract, please contact us.
Two buttons are also available:
- “Add risk”: Enter the Detailed Risk view of a new, unsaved risk to be added to the register.
- “Save”: Save the information in this area.
Note that you must save the risk before you can add any data in the areas 4-8. You can see if a risk has been saved by looking at the ID. If the ID differs from “#0”, then is has been saved. A warning is given if there are unsaved changes present when navigating away from the Add Risk view.
Risk Evaluation
This area contains evaluations of the risk on one or more of the risk targets defined for the project. An evaluation is an assessment of the frequency and the consequences of the risk.
It is possible to set three types of evaluation. Gross, Present and Nett
Gross is the inherent risk, i.e., the risk assessment without any controls implemented
Present is the current evaluation (considering already implemented controls.
Nett is the evaluation the risk can be reduced to if all controls are implemented. Nett is also referred to as the residual risk.
For new risks all risk targets (matrices) are displayed. For existing risks, by default, only the risk targets containing evaluations are shown. To change this, click on the button:
- “Show all”: Show all risk targets.
- “Hide unevaluated”: Show only evaluated risk targets.
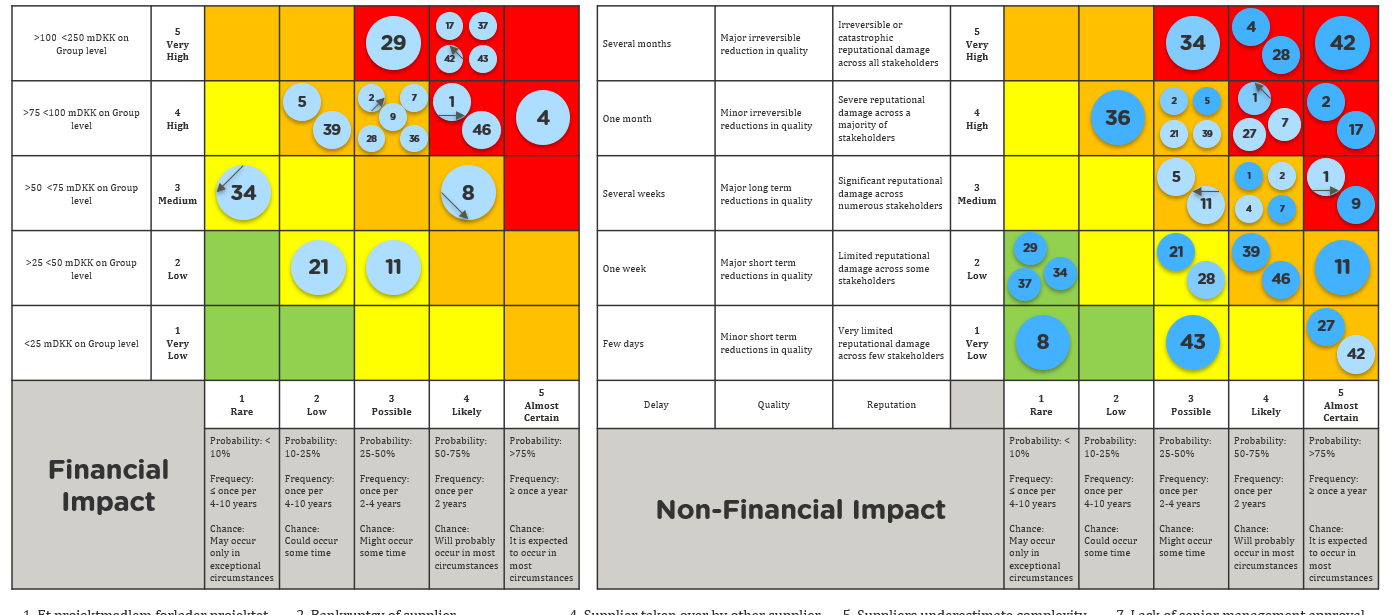
To change the present evaluation of a risk on a matrix simply click on another cell in the matrix and the change will automatically be saved. Hold the mouse over a cell to see the frequency and consequence descriptions associated with it. Alternatively, the small icon of magnifying glasses placed in the top right corner of every matrix can be clicked, as seen in Figure - Risk matrices.
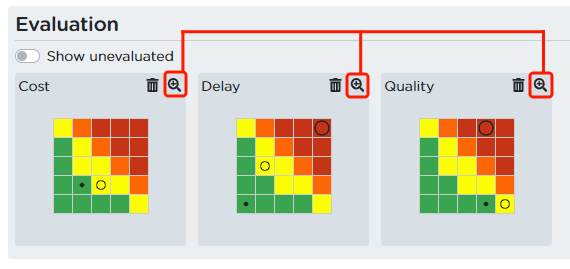
Clicking the icons of magnifying glass will reveal a more detailed view of the matrix in a pop-up window, see Figure - Detailed risk matrix. In this window the frequency and consequence classes of the matrix are visible.
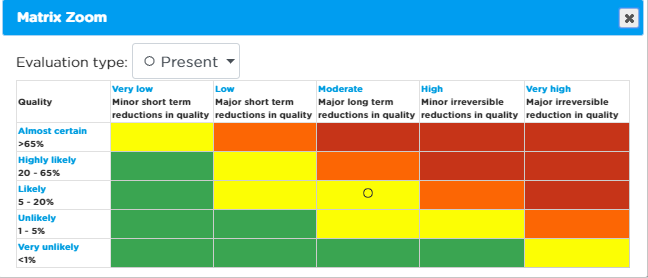
To assign a new evaluation, or change an existing evaluation, simply click the desired cell in the matrix. If you wish to change the evaluation type (gross, present or nett), you can do so by using the dropdown menu. This will close the window and bring you back to the Detailed Risk view. If you do not wish to change the matrix evaluation, just click on the cross in the upper right corner.
You can remove the evaluations on a matrix by clicking the removal icon (like a trash symbol) next to the icons of magnifying glass, see Figure - Risk matrices. Note, that all evaluations (both gross, present and nett) will be removed.
In case your administrator has set up your project to allow for explicit risk estimation, the Detailed Risk Matrix view looks like Figure - Detailed risk matrix, explicit.
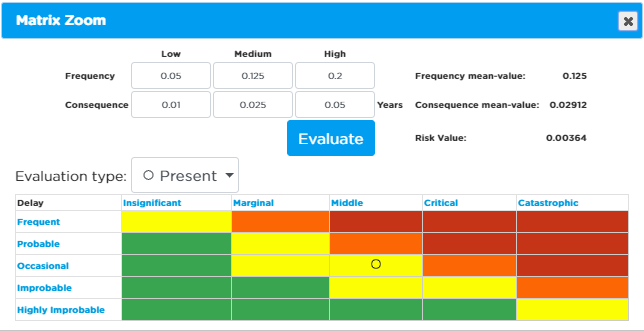
With explicit risk evaluation enabled, you have the option to evaluate the risk either by clicking in the matrix, as before, or by specifying 3-point estimates for both frequency and consequence. Low, medium and high correspond to the 10th percentile, most likely value and 90th percentiles of an Erlang distribution function. Based on these percentiles RamRisk internally calculates the corresponding mean value (for both frequency and consequence) and identifies which matrix cell this corresponds to. The corresponding cell in the matrix will then be highlighted. The calculated mean values are shown in the top right corner. Note that gross, present and nett can all be set by means of using triple estimates.
To remove the evaluation, you must click on the removal icon (like a trash symbol) next to the magnifying glass icon, see Figure - Risk matrices.
Note that you cannot add a risk evaluation before the risk has been saved for the first time.
Controls and Actions
This area contains a list of all controls and actions defined in response to the risk. For an outline of the difference between a control and an action, see Managing risks, controls, and actions. The following buttons are available:
- “Show all actions”: If activated it displays all actions related to the controls in the list, see Figure - Control list with all actions expanded. When deactivated it will hide all actions if some actions are visible.
- “Add control”: Open a pop-up window to add a new control to the risk.
- “Show done/discarded”: If activated all controls with status “Done” and “Discarded” are shown. When deactivated it hides all controls that have the “Done” or “Discarded” status.
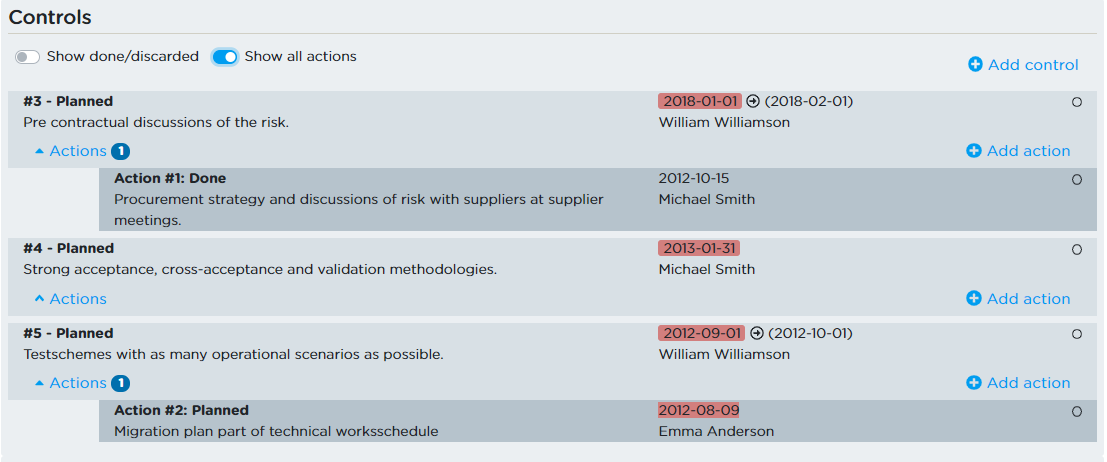
You can see the actions assigned to a specific control by clicking the arrowhead in the bottom of the control as seen in Figure - Controls, expand actions. Controls with actions assigned are equipped with a filled arrowhead (the upper of the two framed arrowheads in Figure - Contracts, expand actions), while controls with no actions assigned are equipped with an outline of an arrowhead (the lower of the two framed arrowheads in Figure - Contracts, expand actions).
Clicking a control or an action brings up a pop-up window with detailed information on the given control or action. Here it is possible to edit the description of the control or action, its status, ownership, and deadline.
Adding a new action to a control is done by expanding the relevant action list (the arrowhead below the control) and clicking “New action”. The empty action list must also be expanded to add the first action to a control.
For detailed information on managing risks, controls and actions, see Managing Risks, Controls, and Actions.
Note that you cannot add controls or actions before the risk has been saved for the first time.
Compact Filtered Risk List
For quick navigation between risks, click the Risk Navigation side menu to see the panel in Figure - Risk navigation.
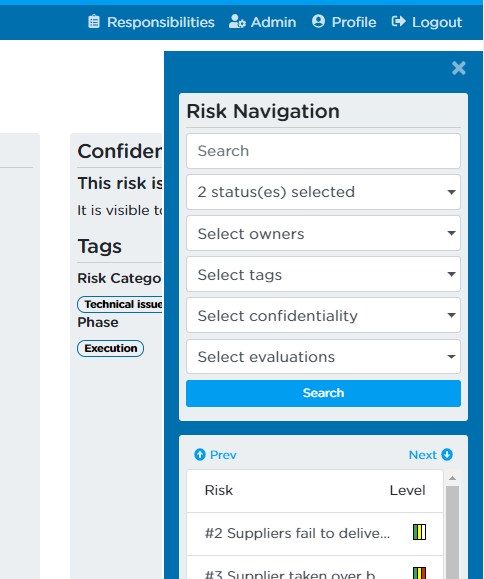
The Risk Filter is automatically transferred from the Risk List view when the Detailed Risk view is entered by selecting a specific risk. A new filter can be applied directly in the Detailed Risk view. The list of the risks resulting from the search criteria is presented beneath the search filter. Note, that after a search the topmost risk resulting from that search will be shown directly in the view.
Above the compact risk list, it is possible to click on the buttons “Prev” and “Next”. This will navigate the Detailed Risk view to the previous and next risk of the compact risk list.
Tags
This area displays and enables the editing of categories and tags that are used to group the risks into appropriate categories such as project phases or technical disciplines. One button is available:
- “Edit tags”: Edit tags of the risk.
The pop-up window shown in Figure - Edit tags results from clicking the button “Edit tags”. Here you can select and unselect different categories and tags. Click the “Save categories & tags” button if you want to save the changes or alternatively the cross in the upper right corner for discarding the changes.
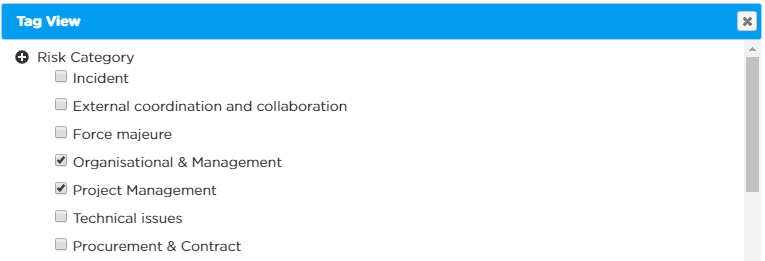
New tags can be added “on the fly” by clicking the “+” sign in front of a main category by the project administrator. Otherwise, the configuration of categories and tags can be done on the Admin page, see The Admin Page.
All the tags can be used for filtering risks.
Note, that tags cannot be assigned to a new risk before the risk has been saved for the first time.
Confidentiality (administrators only)
The button in this section allows you to set confidentiality for the risk, if you are a project administrator. If you are not an administrator, the area will only be visible, if the administrator has restricted the visibility of the risk to at least one user group.
The pop-up window shown in Risk Confidentiality results from clicking the button “Change confidentiality”. A checked group will have access to the risk while an unchecked group will not be able to see the risk. If no groups are checked, the risk is visible to all users in the project.
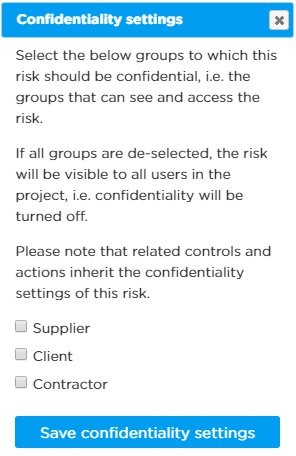
Note, that controls and actions affiliated with the risk will inherit the confidentiality settings. This entails that controls and actions cannot be affiliated with confidential and non-confidential risks at the same time.
Note that if a risk shares controls with another risk, none of these risks can be made confidential as this will cause a confidential control to be visible from the non-confidential risk.
Note that you cannot change the confidentiality settings for a risk before the risk has been saved for the first time.
Comments
List of comments added to the risk. All users can post comments to the risk as part of the follow-up process. All comments are shown with user identification and time of creation. A comment can be understood a “post-it” function.
It is possible for you to edit your own comments, but not comments of other users.
If you want to add additional information to the risk, which you wish to be able to extract in the reporting module, you should use the “Notes” tab instead of placing a comment.
Review & Log
The log is a list of automatically generated entries that contain all the changes to the risk. For more about the log functionality, see The Log Page.
In this section, the status of latest risk review is also visible. Users with the risk reviewer permission can mark a risk as reviewed, and the latest date along with the reviewer\'s name will be shown here. Past review dates can be found in the log.
The Controls Page
This section gives you a general introduction to the topics:
- Controls page
- Combined Risk and Control Filter
- Control List
- Sorting
- List Settings
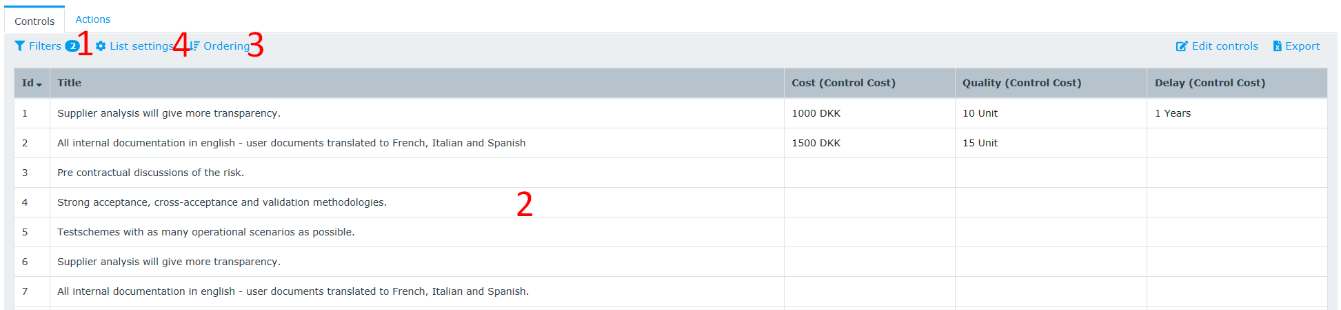
The Controls page is entered by clicking “CONTROLS” in the main menu. The page gives an overview of all the controls in the project. Its structure is like the Risk List view, see Figure - Controls page and the table below for description. Approaching deadlines, i.e. deadlines closer than 14 days from the current date, are marked by yellow and overdue deadlines are marked by red.
The Controls page
Combined Risk and Control Filter
The filter contains two sections. The Risk Filter is identical to the one described for the risk list in The Risks Page. The controls filter has the following filtering options:
- Free text search: Finds the controls for which the text appears in the description.
- Status: Finds controls with the status set to one or more of the following: “Possible”, “Planned”, “Ongoing”, “Done”, “Discarded”.
- Owner: Finds controls owned by specific people.
- Tags: Finds controls that are tagged with specific tags.
- Show unattached: When enabled, controls that are not attached to any risk are also included in the list. Unattached controls are shown by default.
Using the combined filter, it is possible to find specific controls attached to specific risks; e.g. risks owned by one person and controls owned by another person.
A “Search” button is available for updating the controls\' list with the given search criteria.
Control List
Shows a list of controls according to the selected filter. The list can be sorted according to any of the columns by clicking a column header “Id”, “Title”, “Owner”, “Status”, “Deadline”, or “Risk relations”. The arrow shows the current sort order.
A window with detailed information on a control is shown by clicking any row in the list. For more on managing controls, see Managing Risks, Controls, and Actions.
The last column “Risk relations” shows the risk(s) to which each control is attached. One control can be attached to more than one risk. Clicking the risk number will bring up the Detailed Risk view for the relevant risk. For Detailed Risk view, see The Risks Page.
The area includes two buttons in the upper right corner:
- “Edit controls”: See Risk List View for further information on the bulk edit mode.
- “Export to Excel”: Exports the currently shown controls list to an Excel-file
Sorting
- The Sorting section supports ordering by multiple columns. Check/uncheck multiple sorting boxes, and they will all affect the ordering of the list.
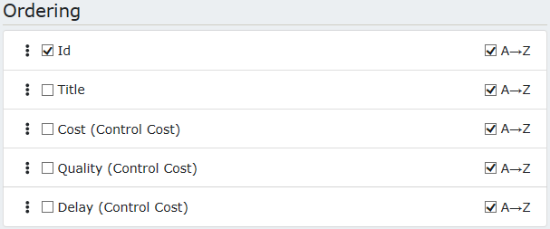
- Change the ordering of sort elements. Sorting directives can be re-arranged, just drag and drop the elements.
- Ascending or descending ordering is controlled with checking/unchecking the A→Z boxes.
List Settings
- List settings controls which columns to show or hide in the Risk List. (it is still possible to edit these settings from the profile page)
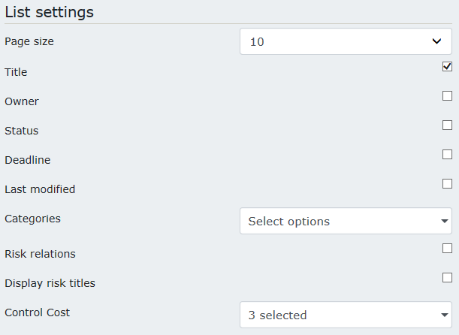
- When a column is shown/hidden, it will update the page right away.
The Actions Page
This section gives you a general introduction to the topics:
- Actions page
- Combined Risk, Control and Action Filter
- Action list
- Sorting
- List Settings
The Actions page is entered by clicking “ACTIONS” in the top menu. The page gives an overview of all actions in the project. Its structure is like the Risk List view and the Controls Page, see Figure - Actions page and the table below for description. Approaching deadlines are marked by yellow and overdue deadlines are marked by red.
The actions page.
Description of areas in Figure - Actions page.
Combined Risk, Control and Action Filter
The filter contains three sections. The Risk Filter is identical to the one described for the risk list in The controls page. The final part of the filter has the following filtering options
- Free text search: Finds the actions for which the text appears in the description.
- Status: Finds actions with the status set to one or more of the following: “Possible”, “Planned”, “Ongoing”, “Done”, “Discarded”.
- Owner: Finds actions owned by specific people.
- Tags: Find actions that are tagged with specific tags.
Using the combined filter, it is possible to find specific actions attached to specific controls and risks; e.g. risks tagged as “Technical”, controls owned one person and actions owned by another person.
A “Search” button is available for updating the actions list with the given search criteria.
Action List
Shows a list of actions according to the selected filter. The list can be sorted according to any of the columns by clicking a column header “Id“, “Title“, “Responsible“, “Status“, or “Deadline“. The arrow shows the current sort order.
A window with detailed information on an action is shown by clicking any row in the list. For more on managing actions, see Managing Risks, Controls, and Actions.
The area includes two buttons in the upper right corner:
- “Edit actions”: See Risk List View for further information on the bulk edit mode.
- “Export to XLS”: Exports the currently shown actions list to an Excel-file.
Sorting
- The Sorting section supports ordering by multiple columns. Check/uncheck multiple sorting boxes and they will all affect the ordering of the list.
- Change the ordering of sort elements. Sorting directives can be re-arranged, just drag and drop the elements.
- Ascending or descending ordering is controlled with checking/unchecking the A→Z boxes.
List Settings
- List settings controls which columns to show or hide in the Risk List. (it is still possible to edit these settings from the profile page)
- When a column is shown/hidden, it will update the page right away.
The Reports Page
This section gives you a general introduction to the topics:
- Reports page
- Current report overview
- Filters, Sorting and Timestamps
- Statistics, Lists and Presentations
- Report Library
The Reports page is entered by clicking “REPORTS” in the top menu.
The Reports page enables compilation of reports and statistics from several predefined functions and tools for data analysis. The output is a MS Word file (.docx) ready for printing and editing. For details, see Figure - Reports page and the description given in the table below.
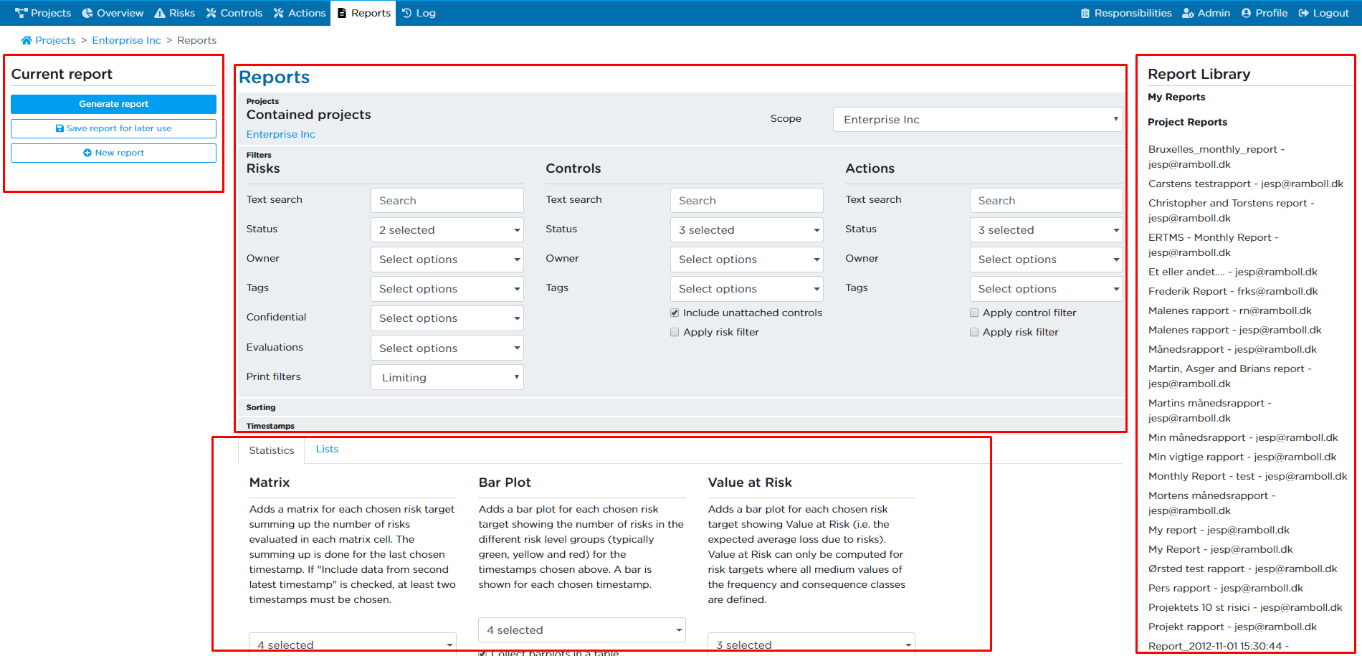
The Report Page.
Description of areas in Figure - Reports page.
Current Report Overview
This section contains a list of the elements currently added to your report. From here you can:
- Remove elements from the report.
- Move the position of the individual elements in the report by 'drag and drop'.
- Generate your report.
- “ Save as new report “: Saves the report as a template for future report. After saving you can change the report name and share it with the other users.
- “New report”: Clears the current report
- “Delete report”: Deletes the report template
- “Apply current filters”: Allows you change the filters of an existing report
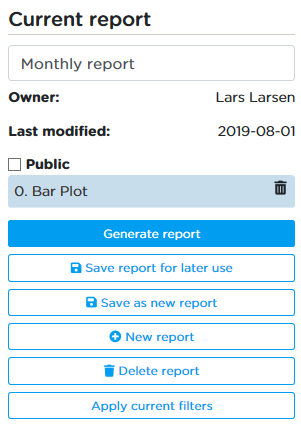
To use the “Apply current filters” you must first select the filters (read more about the filters in report area 2 below) and then click apply. The chosen filters will be applied to all the report elements in the template. If you only want to change the filters on certain elements, click on the report elements individually, change the filters and remember to save using the save button in described in area 2.
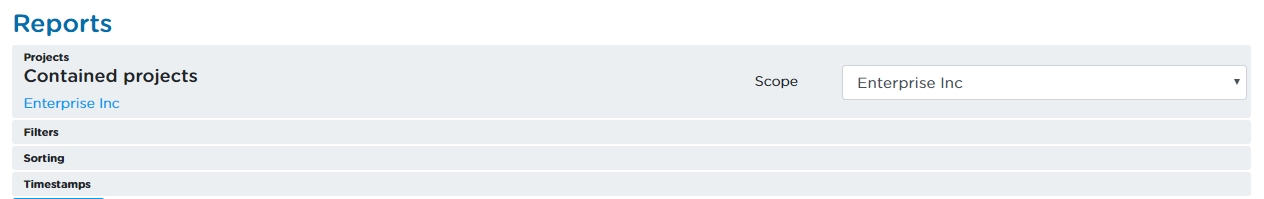
Projects, Filters, Sorting and Timestamps
This section contains four containers: Projects, Filters, Sorting and Timestamps.
In the “Projects” container you choose which project or project group you would create a report element for. If you have access to the Enterprise module, you can create reports with aggregate data from these projects or project groups.
In the “Filter” you can choose which risks, controls and actions you want as basis for the report. There is a separate filter for Risks, Controls and Actions respectively (see Figure - Report filters), making it possible to make an exact specification of what the report should contain.
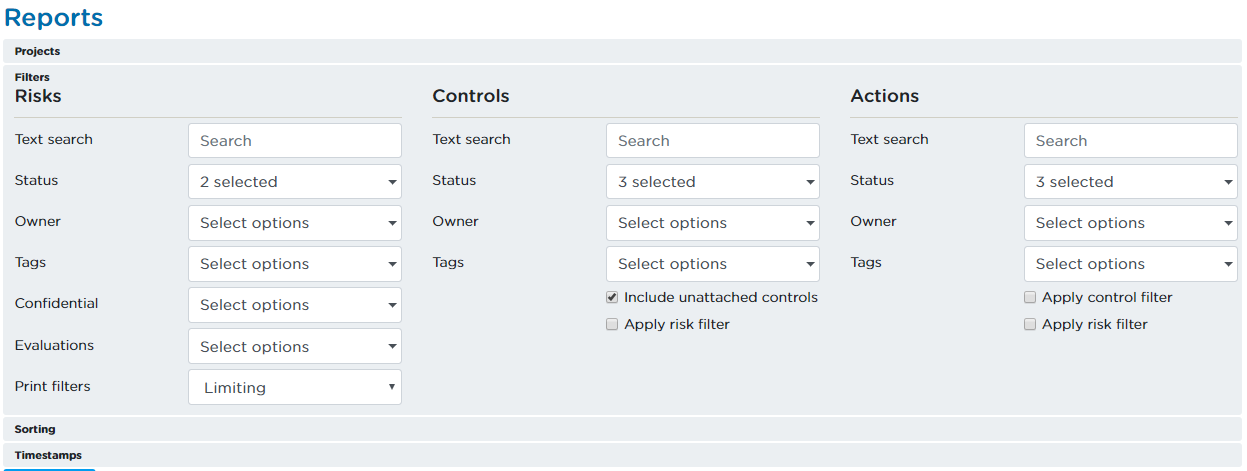
Note that the three filters are hierarchical such that the “Risk filter” is applied first, then the “Controls filter” is applied and finally the “Actions filter”. The only exception from this order is when using the Report elements “Control list” and “Action list” – see the description of these for further information.
The functionality of the filter is identical to the Risk Filter described in The Risks Page, and the filtering is done according to the status of the risks.
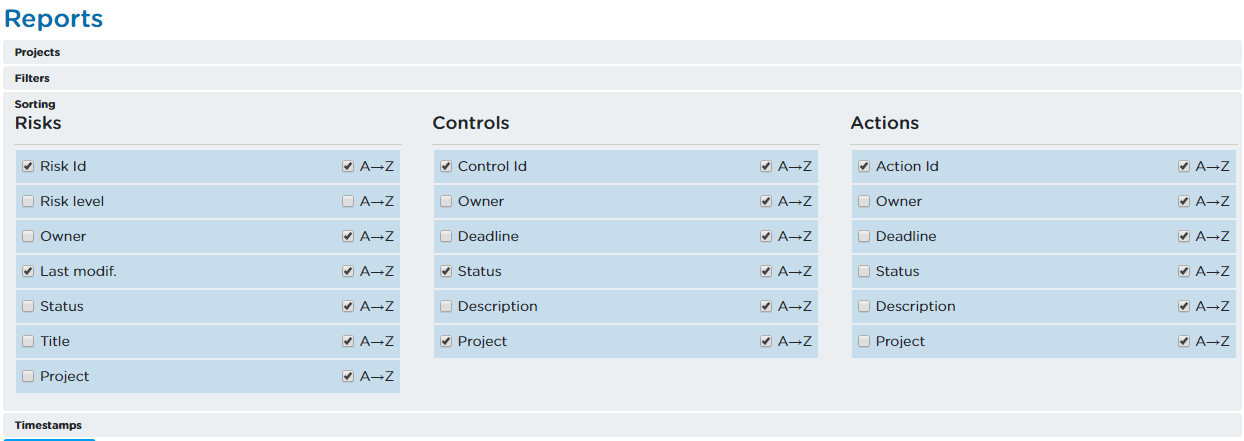
The sorting panel (shown in Figure - Reports sorting) lets you:
- Assign a multi-level sorting to your report.
- Arrange the order of the sorting levels by drag-and-drop.
Click the checkbox in the left part of an element to sort by the given element, check or uncheck the checkbox in the right side of an element to change the sort order, and move elements up or down to define the precedence of elements by “drag and drop”.
Note that when sorting for “Risk level” on Risks, the sorting is only unambiguous for specific risk targets, singularly. Evaluations cannot be compared directly across different risk targets using explicit values. Instead, matrix cell values are used for the comparison. For this reason, the sorting on “Risk level” when multiple evaluations are selected will not reflect the explicit risk values of the evaluations. For more information on how to select evaluations on Risks for reporting, see Section Lists.
The timestamps section lets you (administrator only):
- Create timestamps to keep track of the development throughout the project.
- Manage which timestamps are to be represented in the report.
This function is used by several of the elements in the “Statistics” tab, Area 3 in Figure - Reports page.
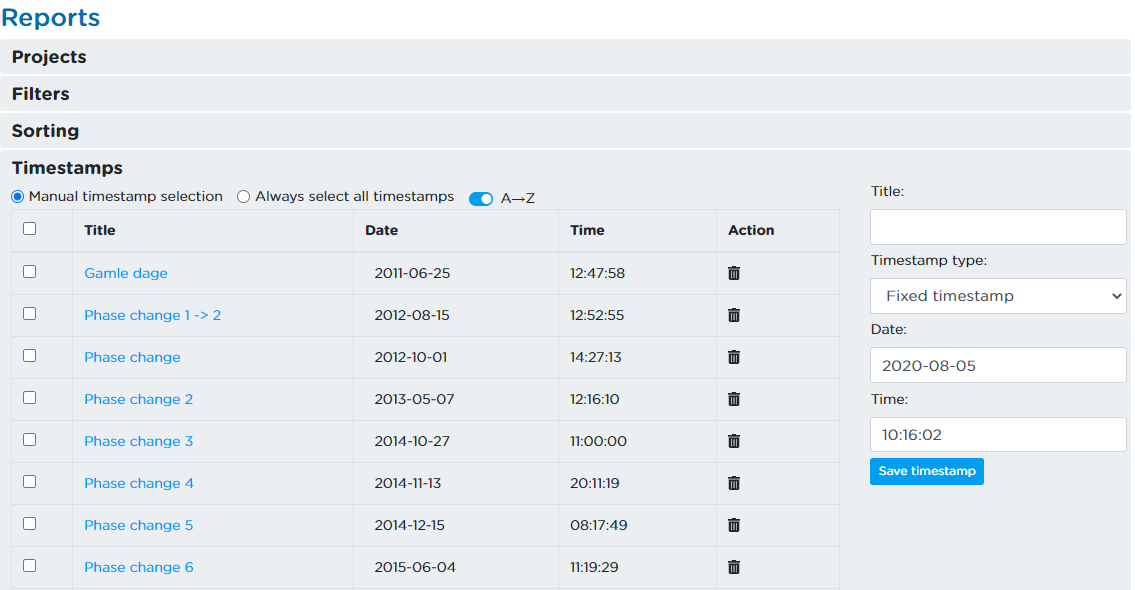
- Set up relative timestamps that allow you to easily manage repeating reporting patterns such as reporting data for “last month”, “last quarter”, “last year” etc.
Relative Timestamps
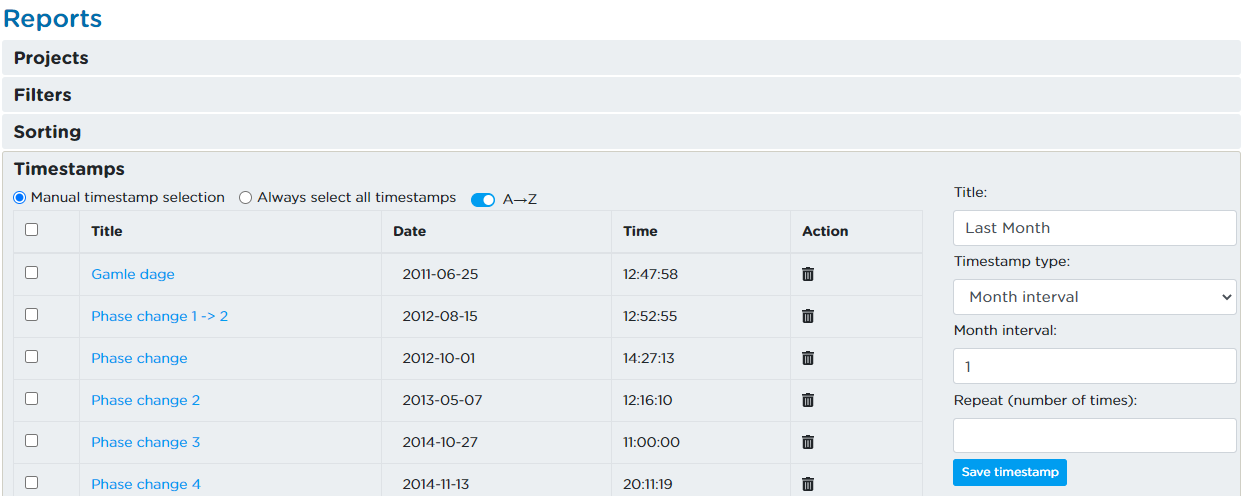
You can also set up relative timestamps, by choosing one of the options for this in the Timestamp type selection (shown in Figure - Relative timestamps).
A relative timestamp is always relative to the report. Once a report is saved that uses relative timestamps a “Relative Start Date” information line will be available under the Current Report overview. This shows the starting time that is used to evaluate relative timestamps. The starting time can be updated using the “Refresh Relative Timestamps” button that is made available for this:
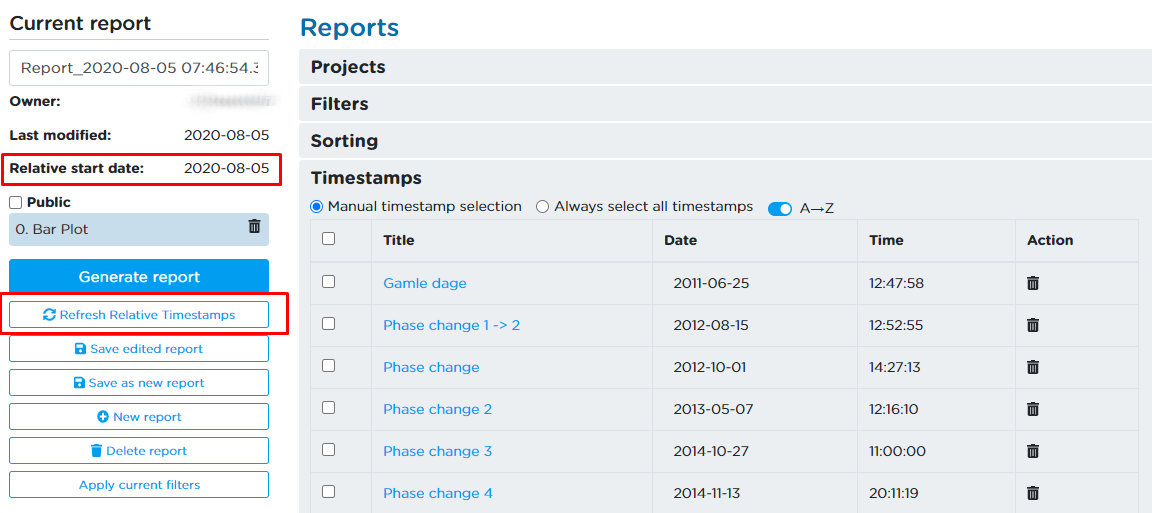
If you are generating a report that is not saved, then the current date is used as a starting point for evaluating the relative timestamps.
The below table provides a description of the available relative timestamp types and what can be achieved with them.
| Relative Timestamp type | Description |
|---|---|
| Interval | Allows you to refer to a previous date that is a certain number of days/months/ weeks/years before the current date (or saved start date of the report) |
| Number | Allows you to refer to a previous date that is on a specific day of the month, month or week of the year prior to the current date (or the report\'s start date). (Note: when using week numbers, ISO-8601 numbering is used.) |
Additional options allow you to use the specified relative timestamp repeatedly to describe a pattern of prior timestamps. This can be useful if you need to set up a report that has several periodic timestamps, such as the beginning of every month for the current year, the beginning of every week etc.
You can use the “Repeat (number of times)” option to ask for a repetition of the relative time calculation. For example choosing a relative timestamp of 1 month interval and then choosing to repeat this 5 times will result in 5 timestamps when the report is generated for each of the past 5 months.
Statistics, Lists and Presentations
This section consists of three tabs: Statistics, Lists and Presentations.
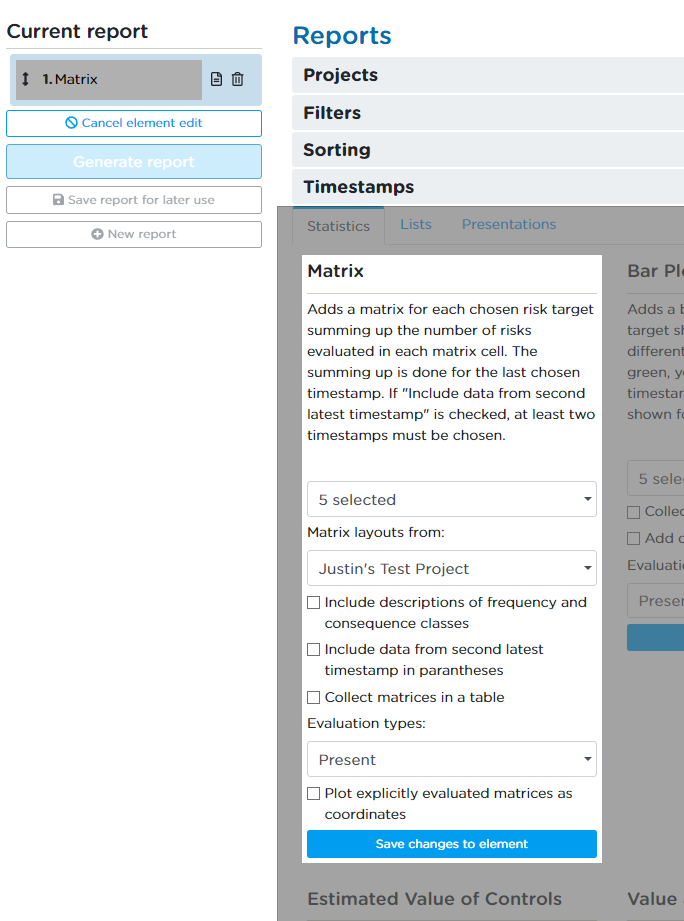
Statistics
In the statistics tab, see Figure - Reports, statistics, it is possible to add elements with descriptive statistics and figures to the report. The content of the elements reflects the applied filter and timestamps. Hereby it is possible not only to report on present risk level, but also include previous development.
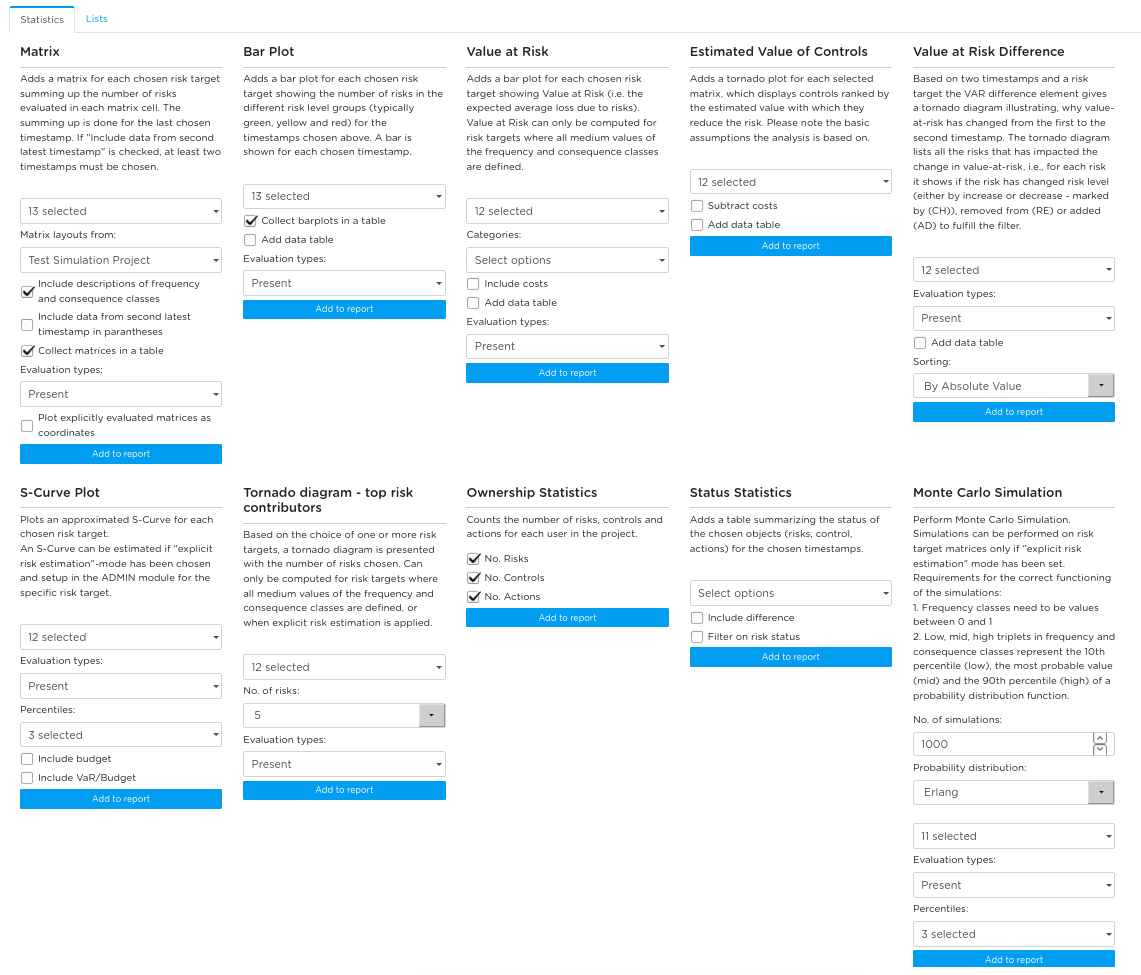
The following elements can be added from the Statistics tab:
- Matrix: Matrix representation of evaluations on chosen risk targets.
- Bar Plot: Individual bar plot for each chosen risk target.
- Value at Risk: Bar chart of estimated value at risk for the chosen risk targets.
- Estimated Value of Controls: Tornado diagram with controls ranked by the estimated value with which they reduce the risk, for the given matrices.
- Value at Risk Difference: Presents a tornado diagram with the risks that impact the change in value at risk from one timestamp to another timestamp on a chosen risk target.
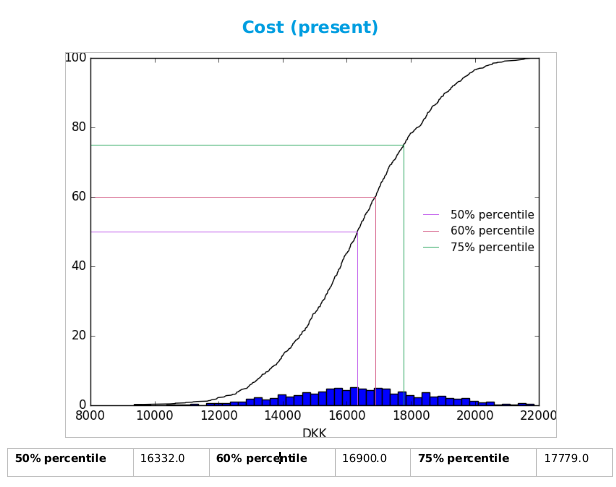
- S-curve: S-curve plot for a specific risk target based on triple-estimates.
- Tornado: Tornado diagram of the top contributing risks to value at risk.
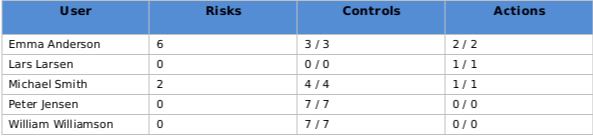
- Ownership Statistics: Numbers of risks, controls and actions for each owner.
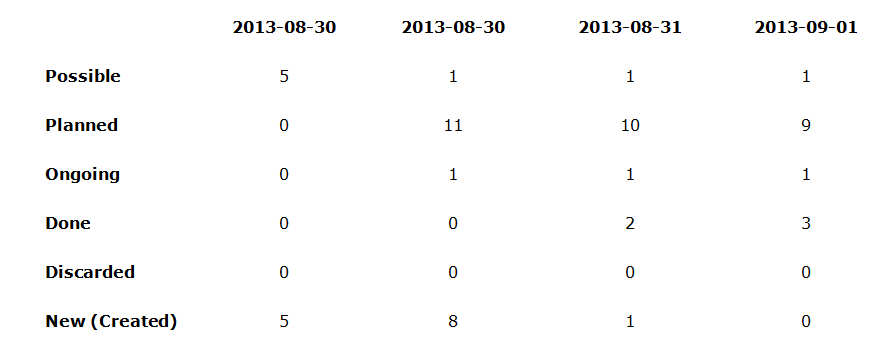
- Status Statistics: Statistics of the statuses of risks, controls and actions.
- Monte Carlo Simulation: simulation plots for each eligible risk target showing a projection of estimated consequences.
The elements are described in detail in the following:
- Bar Plot: An individual bar plot for each chosen risk target. The risks are represented by the coloured groups in which they have been evaluated. For layout purposes it is possible to collect bar plot elements in a table.
- Ownership Statistics: The ownership statistics contains a list with the numbers of risks, controls and actions assigned to the different users connected to the project. The number of risks results from the chosen risk filter (default new and open). The number of possible, planned and ongoing controls and actions are shown as the first number, and second number is the total number of controls and actions, respectively.
- Status Statistics: Statistics regarding risks, controls and actions sorted by their status. The element includes the possibility to calculate the difference from one timestamp to another. Be aware that this element only uses the specified filter if the box “Filter on risk status” is checked.
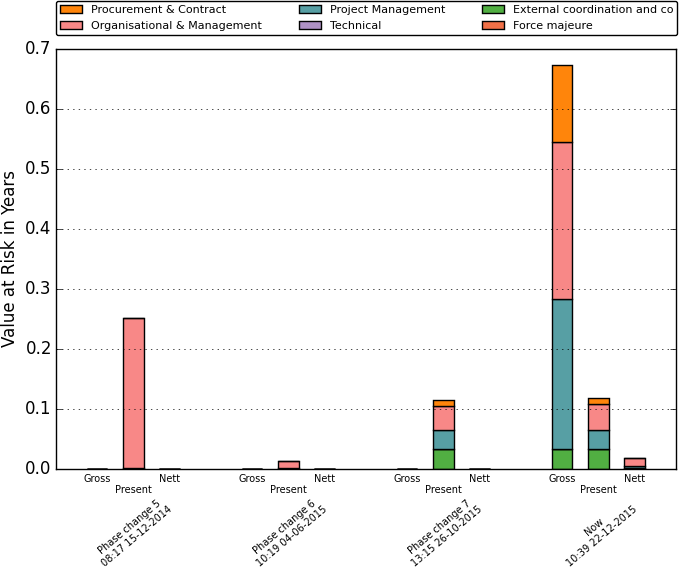
- Value at Risk shows a bar for each timestamp with the estimated value at risk for the chosen risk targets. The plot for a given risk target can only be generated if the medium values of the frequency and consequence classes are defined for the relevant risk target, see Risk Targets. The options for this statistics module include the possibility to insert a table with the data from the plot. It is also possible to create a stacked Value at Risk plot grouped by a selected category.
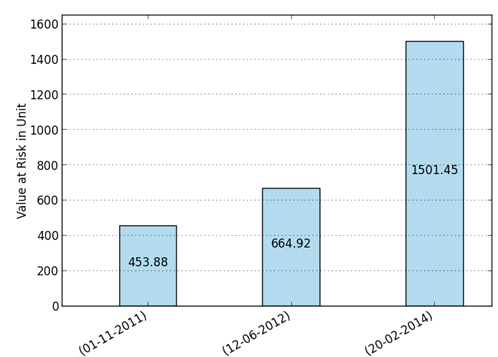
The diagram can contain plots for all evaluation types (gross, present and nett) – see figure below.
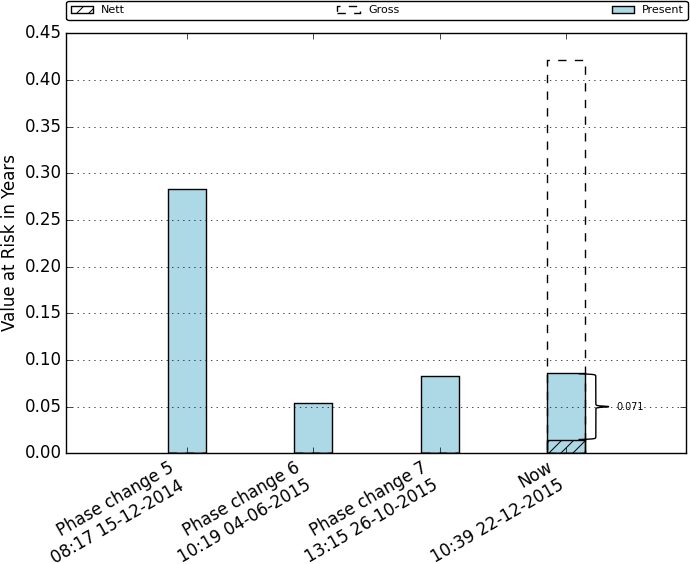
It is seen that the Gross Value-at-Risk is shown with a dotted line, and the Nett risk is shown with a hatched area. The expected possible reduction in risk revel (the present level subtracted the Nett risk level) can be read off the figure. It this case the expected reduction is approximately 0.07 Years
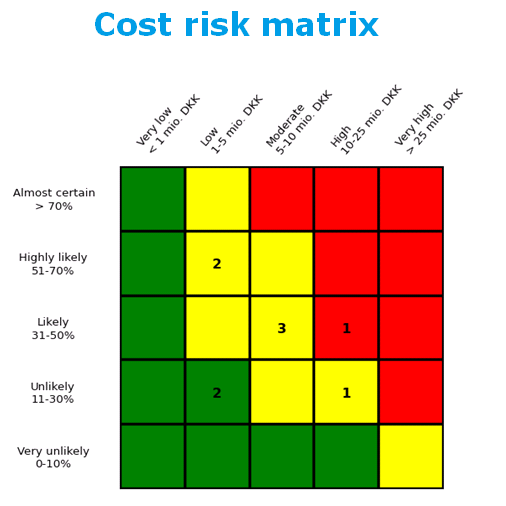
- Matrix: A matrix representation of each individual risk target summing up the number of risks with a certain evaluation. For layout purpose, it is possible to collect matrix elements in a table. A matrix can be generated for each different evaluation type (gross, present and nett).
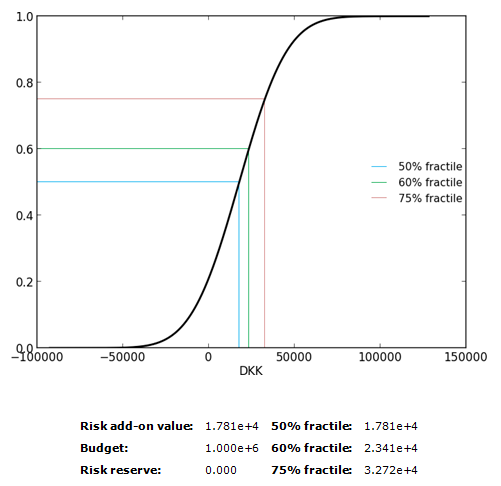
- S-curve: Estimates an approximated S-curve based on the triple-estimates entered for the different risks for a specific risk target. The plot for a given risk target can therefore only be generated if explicit risk evaluation is enabled and the low, medium, and high values of the frequency and consequence classes are defined for the relevant risk target. For more details on this see Risk Targets. It is possible to generate the plot with several percentiles in the range from 5 to 95 with increments of 5. Another option is to include the risk budget and the Value at Risk divided by the budget.
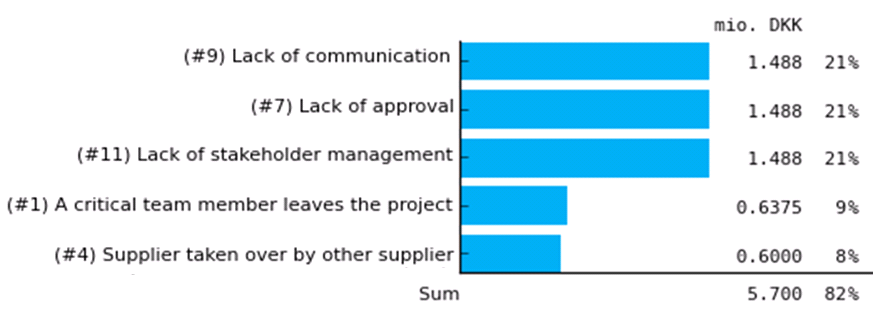
- Tornado: A tornado diagram for one or more chosen risk targets to show several risks that contribute most to the value at risk. It can be used to create a list of top threats and similar opportunities. The plot for a given risk target can only be generated if the medium values of the frequency and consequence classes are defined for the relevant risk target, see Risk Targets.
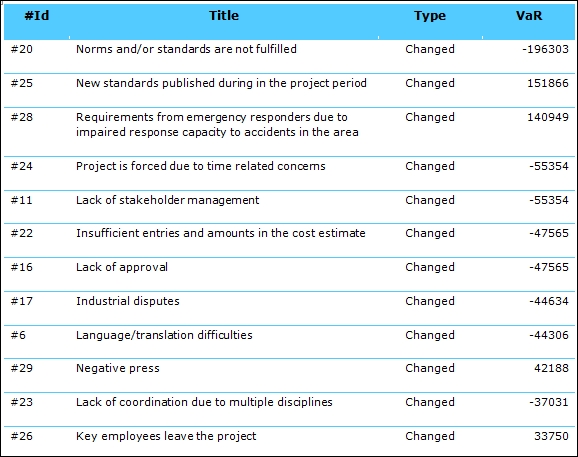
- Value at risk difference: This element allows users to produce Value at Risk difference plots. It makes it possible to visualize how changes in risk levels affect the overall Value at Risk (VaR) for a specific risk target.
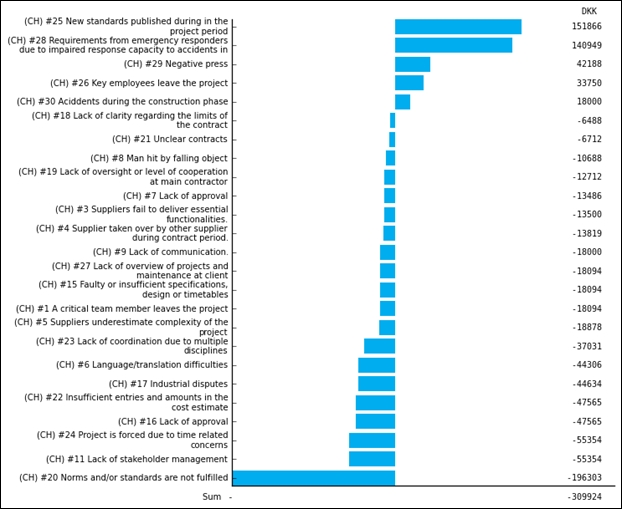
The tornado diagram lists all the risks that has impacted the change in value-at-risk, i.e., for each risk it shows if the risk has changed risk level (either by increase or decrease - marked by (CH)), removed from (RE) or added (AD) to fulfil the filter. In the given example only changed risks are shown.
The included risks can be sorted either by value, type, or absolute value. By checking the Add data table option, the report will also include a tabular presentation of the data.
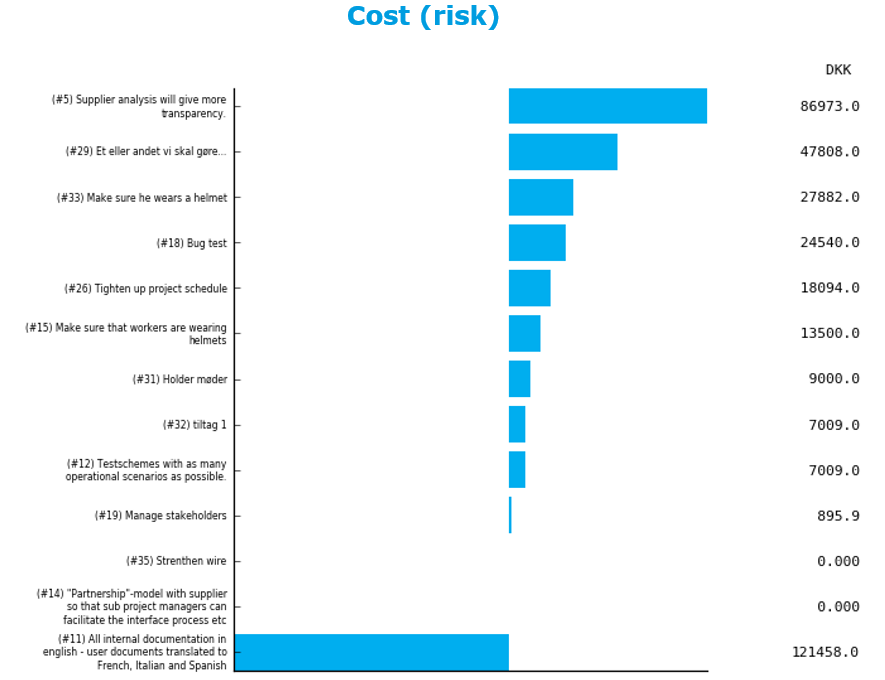
- Estimated Value of Controls: This element allows users to produce Estimated Value of Controls plots. This statistic shows how Controls help reducing the given Risk according to the estimations. This element will produce one Tornado diagram for each matrix that is selected.
- Monte Carlo Simulation: If enabled on your contract, this report element will produce plots containing the simulation results for each risk target that meets the requirements. The simulations will be based on the risk evaluations on each Matrix using the low, medium, and high values of its frequency and consequence classes. It is possible to choose between an Erlang and a Triangular probability distribution for the simulated consequences, for which the low, mid and high values of the consequence in each risk evaluation represent the 10th percentile value (low), the most likely value (mid), and the 90th percentile value (high) of the distribution. Frequency low, mid, high values in risk evaluations will define the lower limit (low), the peak value (mid), and the upper limit (high) of a triangular distribution function used to determine the probabilities of the simulations. Note that frequencies will use a triangular distribution regardless of the distribution function chosen for consequences. Only matrices with "explicit evaluation" mode can be used for the simulations. Furthermore, frequency intervals must be defined between 0 and 1.
Lists
In the lists tab, see Figure - Reports, List tab, it is possible to add elements of more descriptive character presented in lists. As for the statistics the content of the elements reflects the applied filter and timestamps. Hereby it is possible not only to report on present data, but also include previous development.
The following elements can be added from the Lists tab:
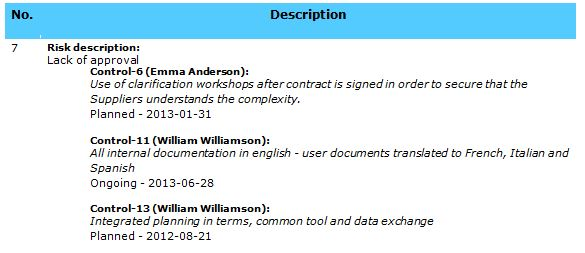
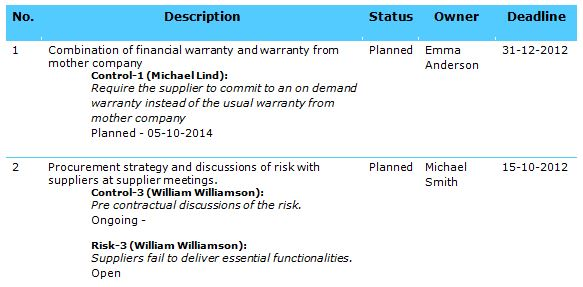
- Risk List: Customized list of the risks in the project.
- Control List: Customized list of controls in the project.
- Action List: Customized list of actions in the project.
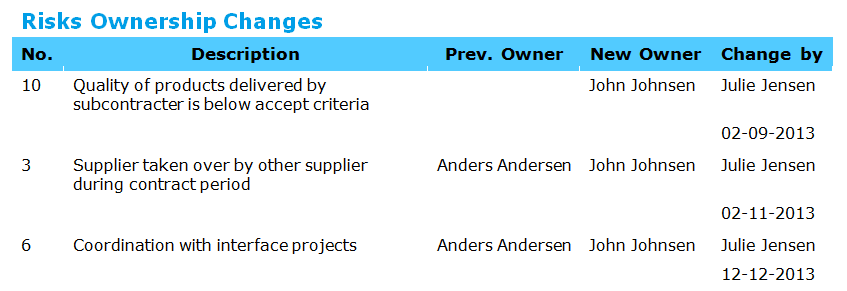
- Owner Change List: List of the ownership changes between to timestamps.
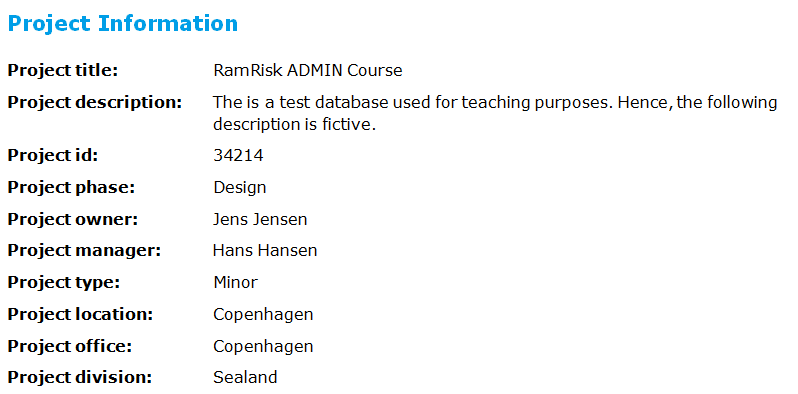
- Project Information: General project information about the project.
- Text Field: Standard text field to a report.
The elements are described in detail in the following.
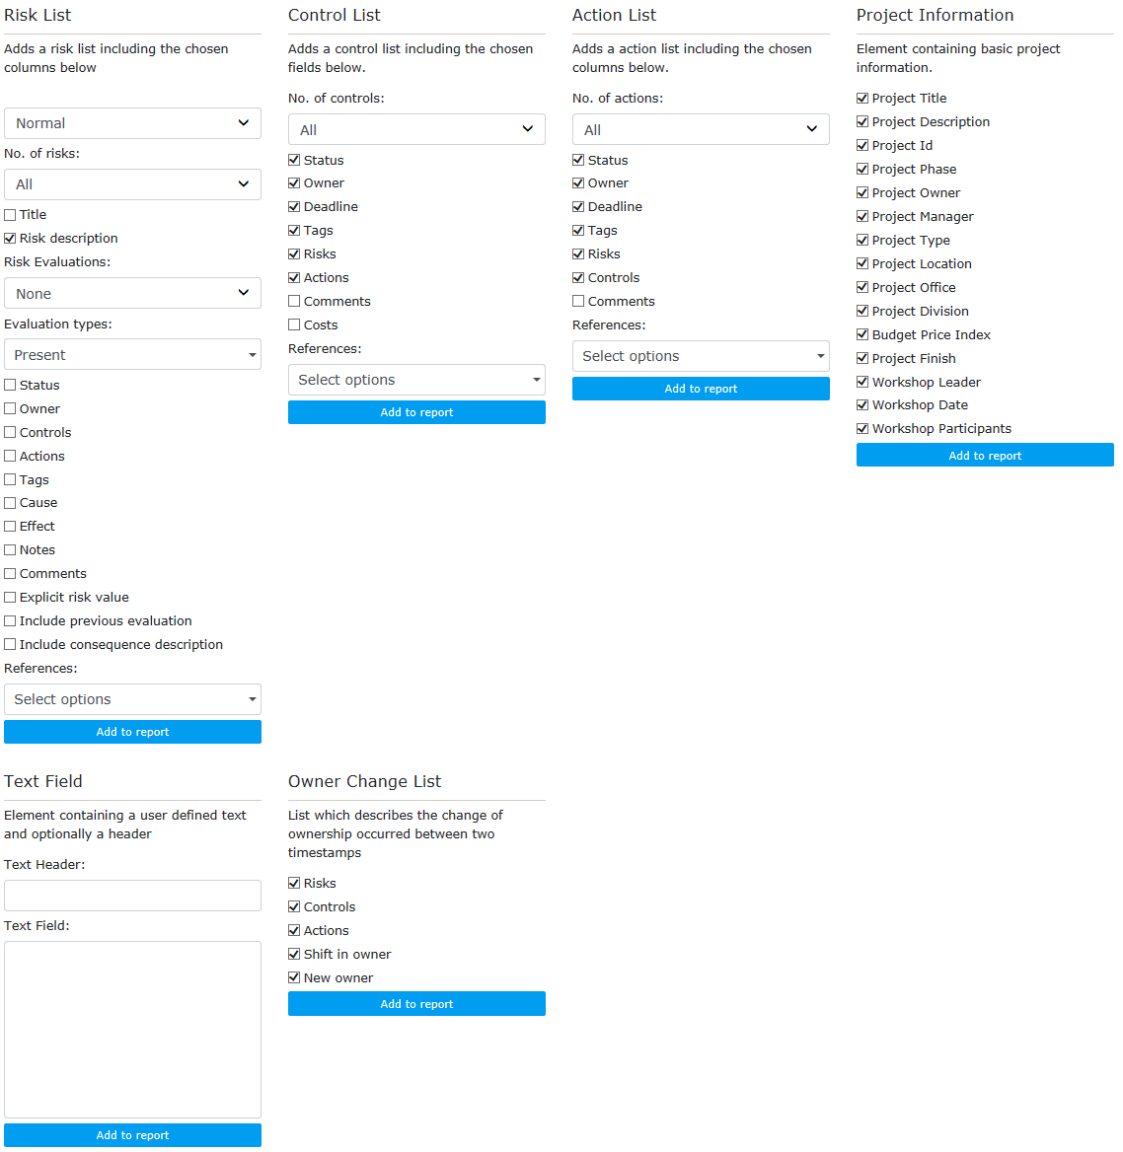
- Risk List: Produces a customised list of the risks in the project. By default, the “Risk id” and “Risk description” are included in the list. The following information is included if selected: “Title”, “Risk description”, “Status”, “Owner”, “Controls”, “Actions”, “Notes”, “Tags”, “Cause”, “Effect”, "References”, "Comments" as well as fine grained control of the Control item fields to be included in the report.
Which risks and risk evaluations that are to be included are determined by the selections in the drop-down. For the risks it is possible to choose between the following options:
- “Normal”: All risks are included.
- “New Risks”: Only risks which are added to RamRisk in a specified period between two chosen timestamps
- “Closed Risks”: Only risks which are closed in a specified period between two chosen timestamps
- “Increased Risk Level”: Risks where the risk evaluation has been worsened between the selected timestamps are included.
- “Decreased Risk Level”: Risks where the risk level has been changed to a lower value between the selected timestamps are included.
For the risk evaluations it is possible to choose between:
- “None”: Risk evaluations are not included in the list.
- “All evaluations”: Evaluations for all risk targets are included in the list.
- “All evaluations with consequence description”: Same as above, but with the description of the consequence class for the given evaluation.
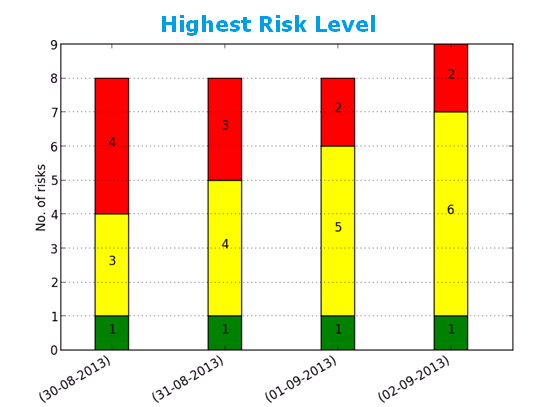
- “Highest risk level”: Only the highest risk level is included in the list.
- “Highest risk level including previous risk level”: The highest risk level for two timestamps are included in the list. Hence you can choose a timestamp for the present period and a timestamp for a previous reporting period.
- “Highest risk and previous level and consequence descriptions”:
Furthermore, it is possible to include only selected risk targets in the risk list.
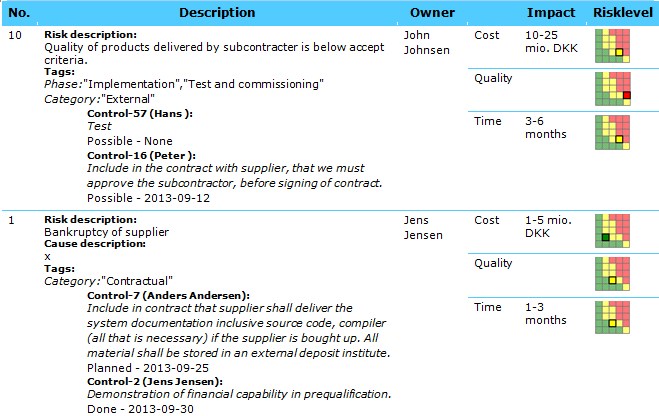
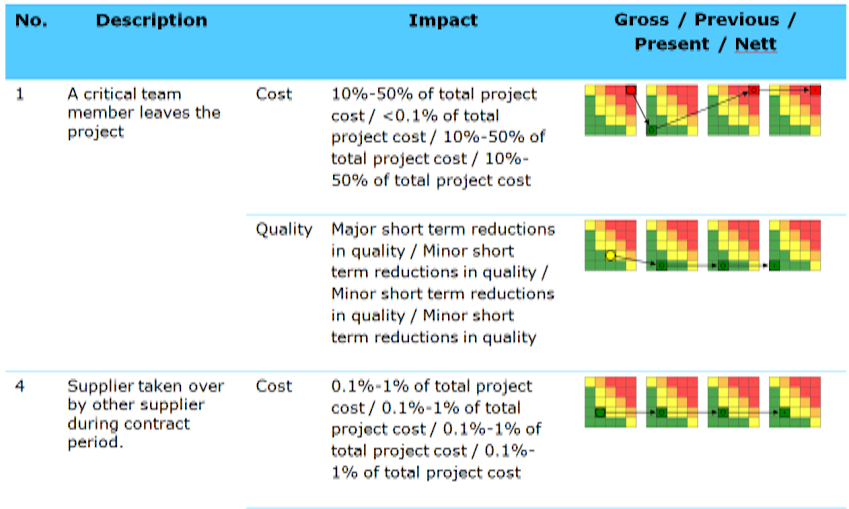
If needed this element can also show a matrix for Gross, Present and Nett, see Figre - Reports, Risk list.
The Risk List will only include risks that satisfies the criteria from the Risk Filter (see description of this in the section concerning Area 1). For the risks that satisfy the criteria from the filter, only controls and actions that match the filter-settings for their respective filter will be present in the Risk List.
- Control List: Produces a customized list of the controls in the project. The functionality resembles that of the Risk List.
Note that the hierarchical order of the filters is different for this element of the report module. Here the Control-filter will have top priority such that only this filter will affect which controls will be in the output of the Control List. The Risk and Action filter will afterwards determine which risks and actions that should be in the report as well.
Action List: Produces a customized list of the actions in the project. The functionality resembles that of the Risk List.
Note that the hierarchical order of the filters is different for this element of the report module. Here the Action-filter will be applied first. The Risk and Control filter will afterwards determine which risks and actions that should be in the report as well.
- Owner Change List: Produces a list of the ownership changes between to timestamps. This element can be customised to contain ownership changes in risks, controls and actions, respectively. Furthermore, it is possible to include changes in ownership, i.e. when the ownership passes from one user to another, and/or include changes in ownership where a user is assigned ownership to a risk that has not previously had an owner.
- Project Information: Adds an extra page in the report specifying general project information about the project. These data come from the setup of the project and include e.g. name of project owner, phase, project manager, etc.
- Text Field: Allow you to add a standard text field to a report, e.g. an agenda for the monthly risk follow-up meeting. You can specify both a header and text field, and you can add as many “Text Field” elements to your report as you want.

Presentations
In the presentations tab it is possible to add report elements that generate slides in a risk related PowerPoint presentation. These elements can not be combined with other report elements that generate a combined Word document, but different presentation elements can be combined to generate slides into a single PowerPoint presentation.
- Risk Slides: Risk slides can be used to represent a single slide for each risk in the register. Each slide could contain detailed information on the risk and its causes, effects and related controls, and could also show evaluations on selected matrices.
- Risk Matrix Plot: A risk matrix plot presentation can be used to summarize and display the evaluations of all risks in the register and how they changed over time. It creates a single slide that shows two matrices and will display all risk evaluations on the corresponding matrix. When two time stamps are selected it will show the change in the evaluation using a change arrow.
How these presentation elements generate the slides depends and varies very much on what specific layout and design requirements your project has. They require specially constructed PowerPoint templates to be able to generate what is needed.
Please contact RamRisk Support with your layout and design requirements or with your existing PowerPoint presentations, and we will create the templates you can use for these presentation elements within your own RamRisk projects.
Configuring report elements
Configuring a report element is done by going to the current report overview and clicking on the report element you want to edit.
When clicking on the report element, the reporting section becomes locked until the element editing is finished by clicking the "Save changes to element" button or the "Cancel element edit" button.
In the "Element edit mode", you can change the name of the report element in the current report by going to it's name, clicking on it, and typing in the newly desired name. You can also change the attributes of the element that were initially set, by going to the highlighted area of the "Report element section" and changind their values.
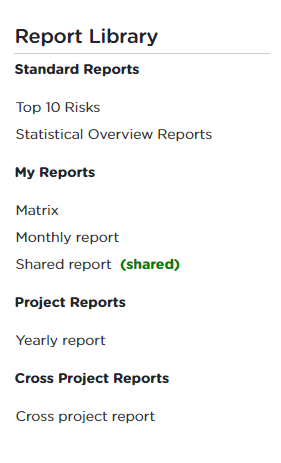
Report Library
The setup of specific reports compiled in Area 5 can be saved for later use. In this way, a report setup with certain elements, e.g. relevant bar plots, risk lists and risk matrix overviews can be saved and used as a template for later compilation of risk status reports with similar contents.
To get you started, a list of standard reports is provided. These reports can be modified and saved as needed.
A report template may be saved as either private or public. Public reports are available to everyone assigned to the project while non-public reports are available to the creator only. A report can be made public or private at any time by ticking or unticking the “Public” box in report area 1 (see Figure - Reports page).
Other users' public reports appear under “Project reports”, whereas all your public and non-public reports appear under “My reports”. When a report is shared with the project this is shown after the report name by adding “(shared)” with bold green letters.
If a report has been made available to the project (“public” is checked) by another user, it will be visible under “Project Reports”. Administrators can now “unshare” by clicking the delete sign next to the report name. Note that the report will not be deleted it will just no longer be shared with the project. Cross-project reports cannot be shared.
Cross Project Reporting (part of the Enterprise module)
Reporting across projects has a few differences compared to regular reporting. The context in cross-project reporting includes everything from all projects involved. This will cause different ways to choose some of the report options.
Selecting Matrices
All matrices from the projects in the selected group will be included in the options. When two matrices match, only one option will be shown. Two matrices across different projects will be considered the same if all the following conditions are true:
- their Risk Targets have the same name
- their Risk Targets have the same unit
- they are both opportunity matrices or risk matrices
- they are both explicitly evaluated, or neither is
Because of these conditions, it is possible for risk targets to share the same name but represent different matrices. For this reason, the option names will be updated to uniquely represent each Matrix during the selection phase.
The following cases apply:
- When a matrix option is uniquely represented, the usual name will be presented \<Matrix name> (risk/ opp.)
- When two matrices differ in unit only, the unit will be included in the option name \<Matrix name> (risk/ opp.) - \<Unit>
- When two matrices differ in that one is explicitly evaluated and the other is not, the text “Explicit” will be appended to the option for the explicit one
- \<Matrix name> (risk/ opp.) - Explicit When all the previous differences occur together, all specifications will be added to the option \<Matrix name> (risk/ opp.) - \<Unit> - Explicit
Tags/Categories
All tags and categories from all selected projects will also be included in the options. Since ordering can differ across different projects, they will be presented in alphabetical order.
Timestamps
Timestamp selection in cross project needs to be redefined for each user.
The Responsibilities Page
This section gives you a general introduction to the topics:
- Responsible
- Status Filter
- Responsibilities
The Responsibilities page is entered by clicking “RESPONSIBILITIES” in the top menu.
The page displays the responsibilities of a given user in terms of which risks, controls and actions the user is owner of, see Responsibilities Page and the description in the table below.
The Responsibilities Page.
Description of areas in Figure - Responsibilities page.
Project
Select a project or a project group to see responsibilities in given project/group.
Responsible
As default the user selected is the user logged in – such that you as default are presented with your ownerships. If you wish to see the responsibilities of another user, choose the user in the Responsible dropdown menu in the upper left corner.
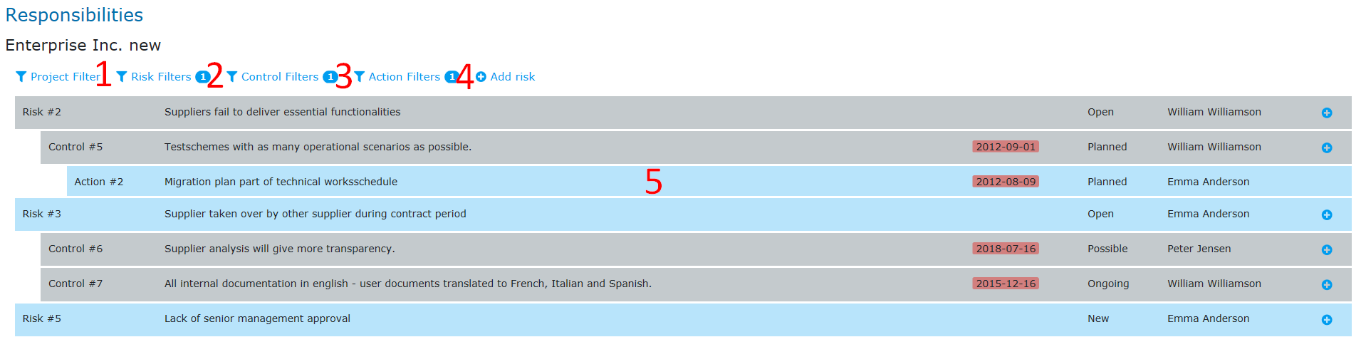
[2 3 4] Filters
The status filter just below allows filtering of risks, controls and actions. The default filtering returns responsibilities connected to:
- New and open risks
- Possible, planned and ongoing controls
- Possible, planned and ongoing actions
To see also responsibilities of e.g. closed risks and controls, change the filtering accordingly.
[5] Responsibilities
A blue background colour is used to indicate ownership of risks, controls and actions for the user chosen in the drop-down menu. Risks and controls presented on a grey background are owned by other people but shown because the currently selected user owns related controls or actions.
The status of the risks, controls and actions are shown together with the deadlines of the controls and actions. Passed deadlines are marked by a red background colour, see Figure - Responsibilities page.
Clicking a risk will open the Detailed Risk view in a new browser window with the filter set to show all the current user\'s risks, see The Risks Page.
Clicking a control or action will bring up a pop-up window with detailed information on the given control or action.
Clicking a “+” sign to the right of a risks opens a blank control pop-up for adding a new control to the given risk. Clicking the “+” sign to the right of a control opens a blank action pop-up for adding a new action to the given control.
The Log Page
This section gives you a general introduction to the topics:
- Risk and Log Filter
- Project Log
- Detailed Log Entry View
The Log page is entered by clicking “LOG” in the top menu.
The page displays the log of changes made in the risk register, see Figure - Log page and the description in the table below.
The Log page.
Description of areas in Figure - Log page.
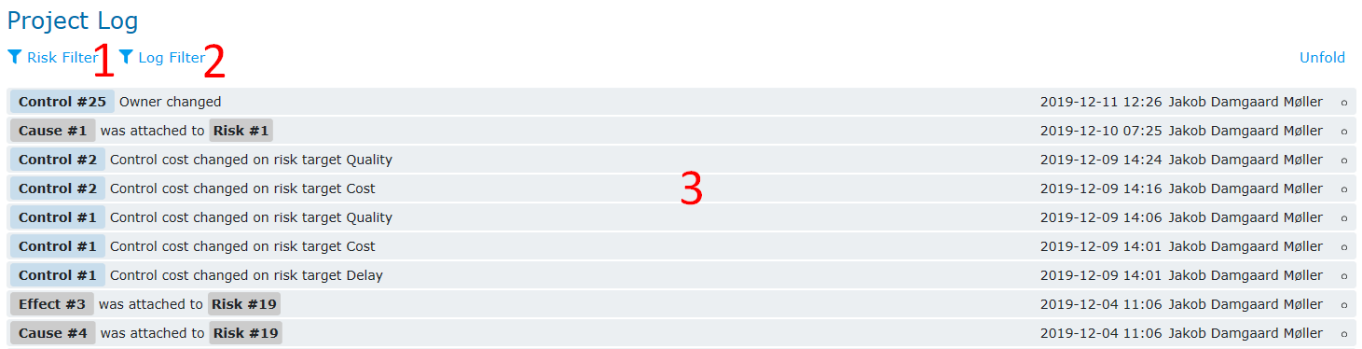
[1 2] Risk Filter and Log Filter
The filters can be used to filter specific log entries to be displayed in the Project Log (area 2). The filtering can be done both on risks (Risk Filter) and/or on specific changes made to the risk register (Log Filter).
The Risk Filter is identical to the filter on the other pages. It allows for filtering after free text, Status, Owner, Tags, Confidentiality and Evaluation. The Project Log then display only log entries of changes made to the risks resulting from the applied filter.
The Log Filter allows to specify the search to changes of specific objects (risk, control, action), type of change (title, description, status, owner, evaluation, tags, deadline, attach, detach), user who did the change, time interval (from and to) when the change was made, whether notes was included during the change, and whether the change was initial to the register (e.g. adding a new risk, evaluating the risk for the first time), or a change of something existing (e.g. changing owner).
[3] Project Log
The Log page displays all changes made in the project, see Figure - Log, detailed. It contains information about:
- What object has been changed, e.g. a risk.
- What has been change, e.g. a new evaluation or a changed description.
- By whom and when the change was done.
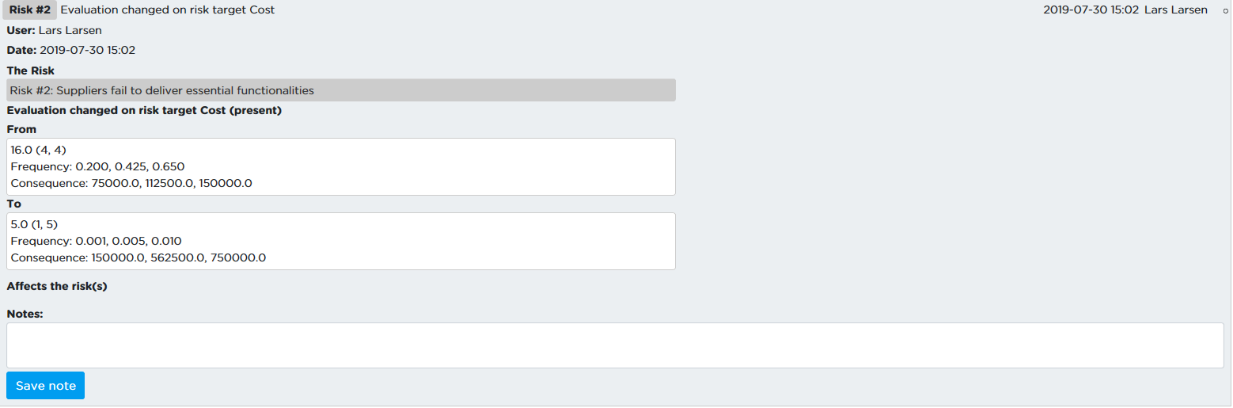
For details about a log entry, simply click on the entry to open a pop-up window with additional information about the change. The additional information of the change is the following:
- The name of the specific object(s) that have been changed.
- A complete record of the previous and current value of the changed property.
- Notes regarding the change, if filled out by the user, who did the change.
This pop-up window can also be accessed from a specific risk in the Log area, see Detailed Risk View.
A filled circle (•) indicates when a note is attached to a log object.
The BIM Page
the BIM module enables risk managers to upload project BIM models and interact with them directly on RamRisk. The BIM tools have been designed to require no prior knowledge of BIM or BIM authoring tools. The focus is on letting risk managers easily view the models in 3D and identify risks.
Viewer
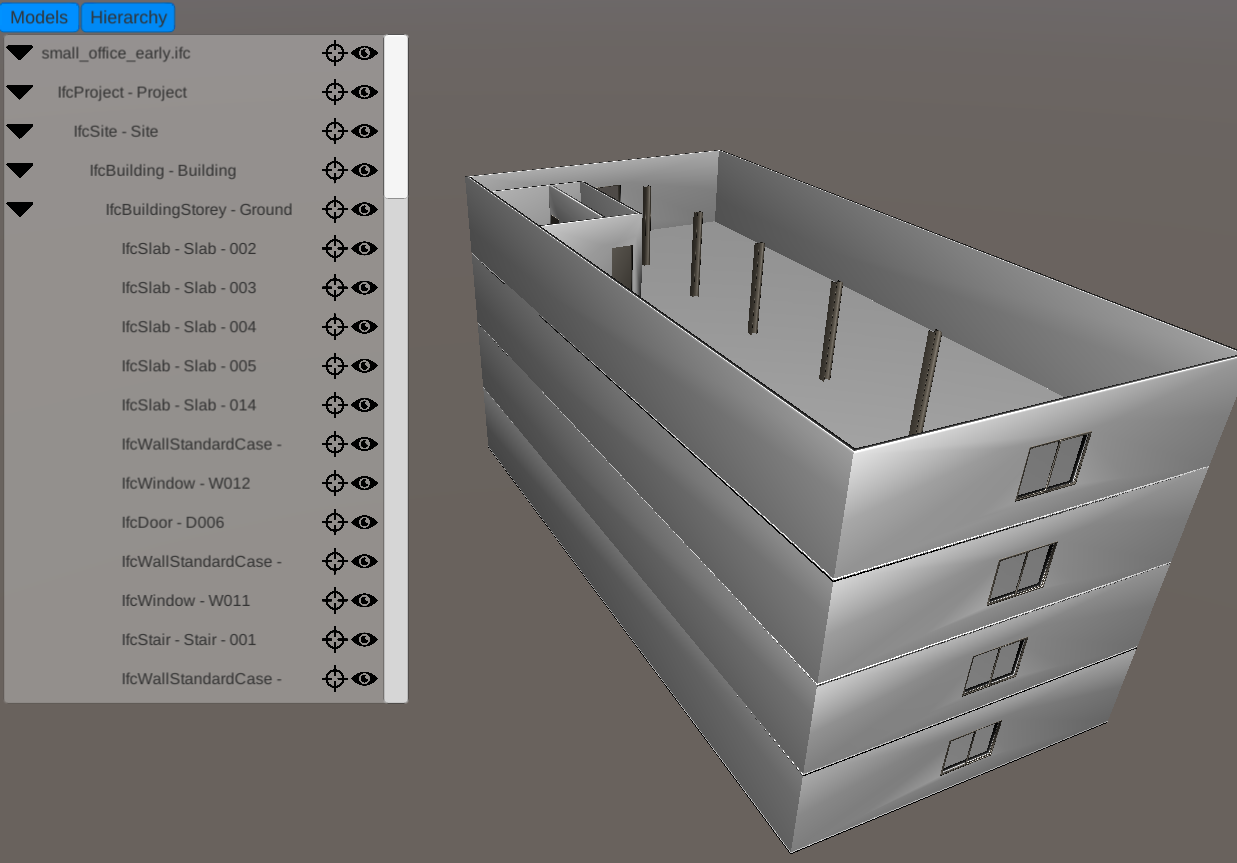
If the BIM module is enabled for your project, the BIM menu button is reachable in the top menu. The viewer is where the 3D models will be visualised and interacted with. When the viewer link is clicked, a new window will open, and the viewer will launch.
From the "Models" menu in the top-left corner of the screen, you can load one or more models into the viewer at a time to interact with them.
Here is a list of interactions:
- Filter the risk list in the RamRisk window, and the viewer will filter the visible risk markers and adjust the camera
- Highlight risk markers by selecting their risk in the risk list. A risk can be selected with a single click or by using the arrow keys in the list. A double click will open a panel with the risk information
- Click a risk marker in the viewer, and the details of the related risk will be shown in a panel. This includes a link to the risk page and a list of markers that can be selected, deleted, or transferred
- Click an empty location in the BIM model to create a new marker. If a risk is selected in the list, the marker will be saved on the selected risk, otherwise a risk title will be required to create a new risk for the location.
- Transfer a risk marker to another risk by selecting the marker in the model and clicking on a risk in the list. A new button will appear that will make it possible to transfer the marker to the selected risk
A risk marker in this context is a 3D object visible in the viewer. It represents the location of a related risk. A risk can have multiple markers as needed.
Adding risk markers to physical risks gives a great overview of risk hotspots on a model. The opposite is also true; there may be parts of the model where no risk has been identified, and that might afford a closer look.
Having the model visual and interactable also aids the risk identification process, particularly during workshops, where users can fly around the model and inspect the details.
Library
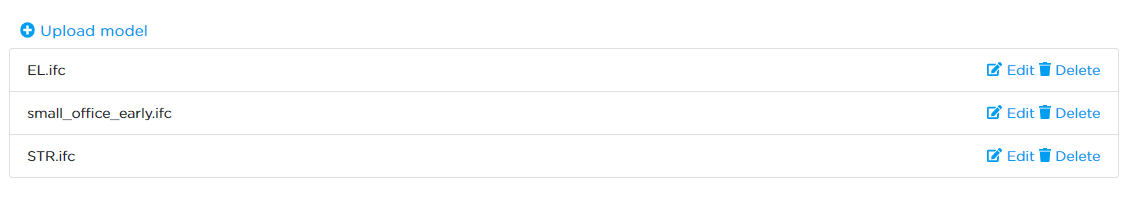
A link to your BIM library page is available from the viewer under the "Models" panel. To get started, go to the library page and upload your model IFC file. Only the IFC file format is supported at this time.
It is important to know that a BIM model is a living thing that changes frequently. When an updated IFC file is received, simply go back and edit your model in the BIM library and then upload the updated IFC file. RamRisk will consolidate the changes and preserve the work that has been done on the previous model.
Once an IFC file is uploaded, the RamRisk service will start processing the file. Depending on the size of the file, this may take some time. The status of the processing task is presented in parentheses after the model names. If there is not parenthesis then the processing is done.
Controls
This section provides a brief overview of the controls and interactions available in the viewer
- Hold right mouse button to look around (rotate the viewport)
- Left click on the model to place a marker
- Left click on a marker to see details of that marker and its risk
- Double click on a marker to navigate to the risk page of the related risk
- Hold both mouse buttons to fly forward and navigate by moving the mouse
- Hold left shift button to go faster
- Press W, A, S, D to go forwards, left, backwards, and right, respectively
- Press E and Q to go up and down respectively
Managing Risks, Controls, and Actions
This section gives you a more detailed introduction to the topics:
- Managing Risks
- Risk Status
- Managing Controls
- Control Status
- Add a New Control
- Edit Control
- Managing Actions
- Action Status
- Add a New Action
- Edit Action
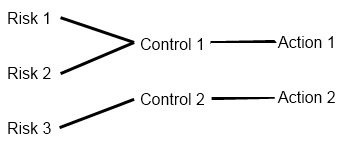
It is important to be aware of the risk object hierarchy to navigate around RamRisk. The hierarchy has the following attributes:
- Risks are independent from one another.
- Controls are attached to one or several risks.
- Actions are attached to a specific control.
The hierarchy is illustrated in Figure - Object hierarchy.
Managing Risks
Risks are the main objects in the risk register, which all other objects relate to. All risks are independent, and the list of new and open risks is the main view of RamRisk.
Risk Status
A risk is given one of the four statuses described in Risk Status. The risk statuses are used when managing the risks as well as when compiling reports.
| Risk Status | Description |
|---|---|
| New | A newly identified risk, which is not yet accepted as a part of the risk scope |
| Open | An open risk which is accepted as part of the risk scope |
| Closed | A risk which can no longer occur and hence is no |
longer part of the risk scope |Discarded | A risk which is not relevant to the project, e.g. covered by another risk
Risks are managed from the Risk List view and the Detailed Risk view, see The Risks Page. The contents of a risk can only be changed from the Detailed Risk view where all relevant information is available; e.g. a list of attached controls, other risk evaluations, the risk owner, and comments.
Managing Controls
The controls are objects describing measures to be performed to control one or more risks. A control may be described as a specific action or as an overall task. For example, a specific action may be to conduct a specific interface coordination workshop, and an overall task may be to conduct interface management. A specific control may not need further actions to be operational whereas a more overall task such as interface management may need several, specific actions to be carried out; e.g. identification of interfaces, establishment of interface register, coordination with specific partners, etc. For details on actions, see The Actions Page.
One control may relate to several risks such that several risks benefit from carrying out the measures related to the control. Hence, a control may be attached to more than one risk as illustrated in Figure - Object hierarchy.
Control Status
A control is given one of the five statuses described in Table - Control status. As for the risks, the control statuses are used when managing the controls as well as when compiling reports.
| Control status | Description |
|---|---|
| Possible | A proposed control, which is possible, but not finallyplanned. |
| Planned | An accepted control, which is planned with a deadline and responsible. |
| Ongoing | An accepted control, as above, where the measures of the control have been initiated, but not yet finished. |
| Done | A control of which the measures have been implemented. |
| Discarded | A control, which is discarded, i.e., not to be implemented. |
The risk owner and the risk manager must consider the controls when evaluating a risk. It is important to be consistent when deciding which control effects to include in the risk evaluation and which control effects not to include. Table - Control Status, effects describes a guideline for deciding which controls to include in the evaluation.
| Control status | Description |
|---|---|
| Possible | Do not include effect. |
| Planned, Ongoing | Include the effect if the control has a certain risk reducing effect. |
| Done | Include the effect. |
| Discarded | Do not include the effect. |
Add New Control
A new control can be added from two different views in RamRisk:
- Detailed Risk view, see The Risks Page.
- Responsibilities Page, see The Responsibilities Page.
Adding a new control brings up the pop-up window shown in Figure - Add control.
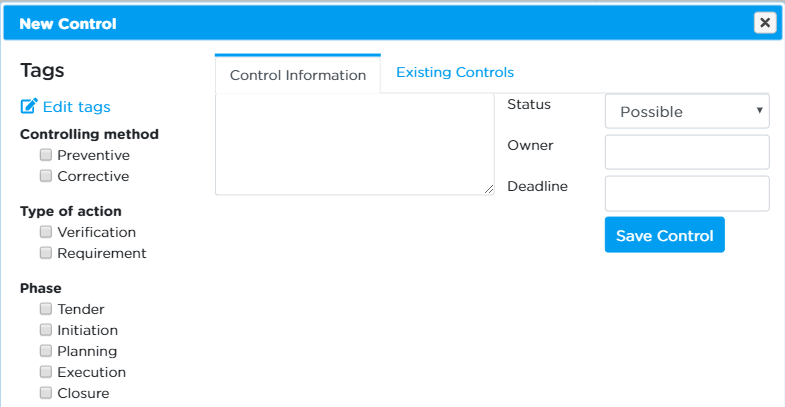
You can type in the control information as well as the status, owner and deadline of the control. The functionality of the fields Status (“Possible”, “Planned”, “Ongoing”, “Done” and “Discarded”) and Owner are the same as for the similar fields in the Detailed Risk view, see The Risks Page. You can type dates directly into the Deadline field on the form “YYYY-MM-DD” or chose a date from the drop-down calendar.
For a given risk, it is possible to attach an existing control using the “Existing control” tab, hence sharing controls between risks. The search field lets you search through the “control information” of existing controls already in the system. The search results are listed in the right-hand side of the pop-up for selection. This is shown in Figure - Add existing control, using “contract” as search string. In this example the search results in three controls where the word “contract” is a part of the control information. Note that when a control is shared between two risks, the control is assumed to be fully identical for each of these risks, including all actions. Note that as default only controls with the status of “Possible”, “Planned” or “Ongoing” is shown in the search result.
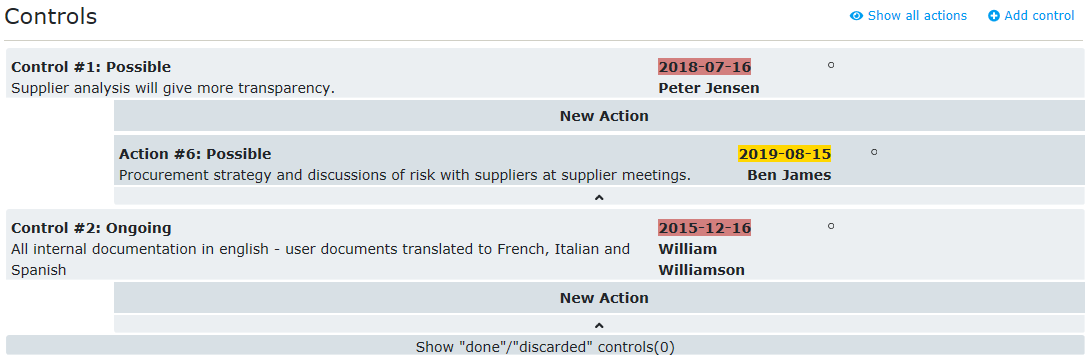
Select one of the controls from the list by clicking it. This will open the existing control and make a new tab, “Relations”, accessible. This is shown in Figure - Edit control.
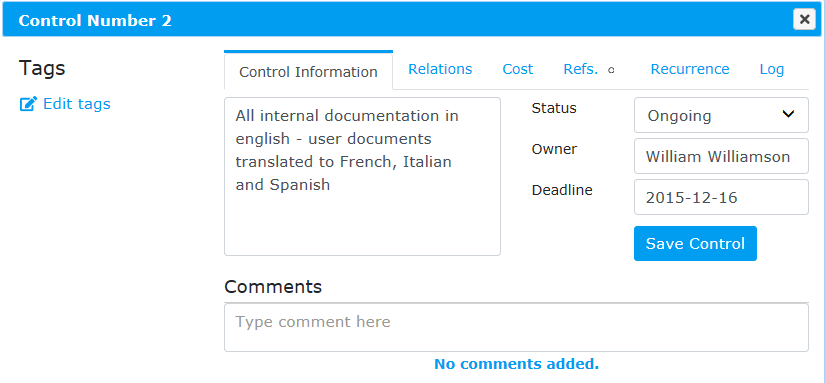
When finished editing the control click the “Save control” button in the “Control Information” tab.
Edit Control
Controls can be edited from three different views in RamRisk:
- The Detailed Risk view; see The Risks Page.
- The Controls list view; see The Controls Page.
- The Responsibilities view; see The Responsibilities Page.
From each view, clicking the control will bring up a pop-up window with a description of the control and possibility to change status, owner and deadline. Once a control has been saved, it is possible to add comments to it. These comments are not part of the control description but can be used as part of the follow-up process like the comments to risks in the Detailed Risk view; see The Risks Page.
Figure - Control relations shows a control opened for editing. The leftmost column shows the tags of the control sorted in categories. Using the “Edit tags” button it is possible to assign tags to the control – or to edit the tags already assigned to the control. Please note, that if no tags have been defined, the “edit tags” button will be greyed out.
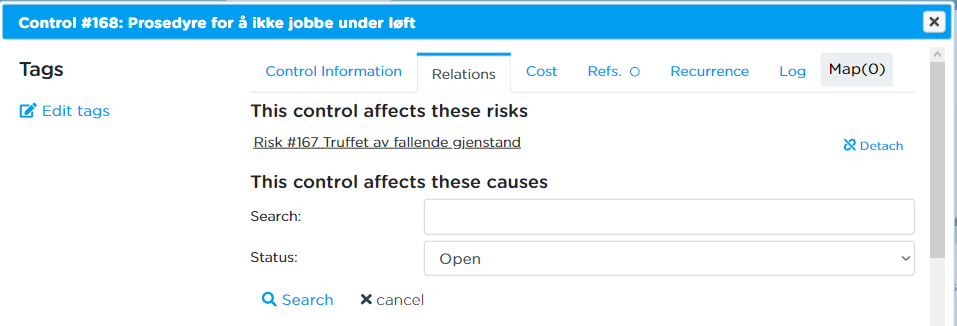
The “Relations” tab contains a list with links of the risks, causes and effects that the control is attached to. From here it is possible to navigate to a listed item and to detach the control from any item by clicking the “Detach” link.
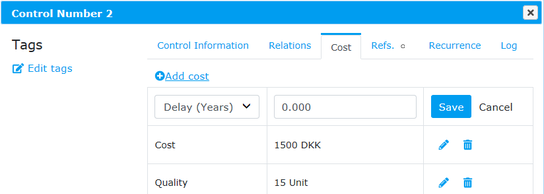
The “Cost”-tab contains a list of costs and the option to add new costs and edit the existing costs on the control.
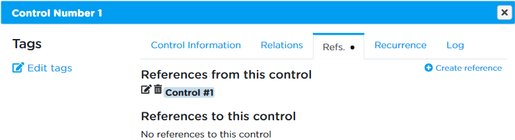
The “Refs” tab contains the references for the control. For further description of this, see The Risks Page.
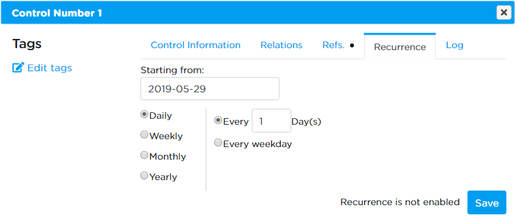
The “Recurrence” tab contains the recurrence settings for the control.
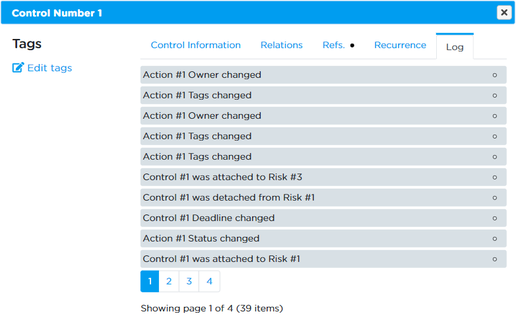
The “Log” tab contains the log for the control.
Managing Actions
An action is a very specific task to be carried out in relation to a given control. Actions are intended to be so specifically related to a given control, that these cannot be associated with more than one control.
Action Status
As for controls, an action can be given one of the five statuses described in Table - Action status.
| Action status | Description |
|---|---|
| Possible | A proposed action, which is possible, but not finally planned. |
| Planned | An accepted action, which is planned with a deadline and a responsible. |
| Ongoing | An accepted action, as above, where the measures of the action have been initiated, but not yet finished. |
| Done | An action of which the measures have been implemented. |
| Discarded | An action, which is discarded, i.e., not to be implemented. |
Adding a New Action
New actions can be added from two different views:
- Detailed Risk view, see The Risks Page.
- Controls Page, see The Controls Page.
- Responsibilities Page, see The Responsibilities Page.
The pop-up window in Figure - New action is shown when adding a new action. Here, it is possible to describe the action in the field “Action Information”, and it is possible to indicate a status, an owner, and a deadline. The action is saved by clicking “Save Action”.
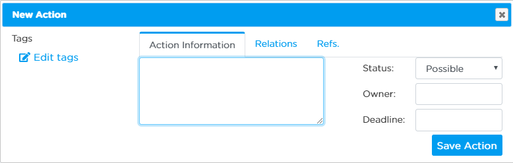
Edit an Action
Actions can be edited from three different views:
- Detailed Risk view; see The Risks Page.
- Actions Page, see The Actions Page.
- Responsibilities Page, see The Responsibilities Page.
A pop-up window appears when clicking an action. The window contains three tabs: “Action Information”, “Relations” and “refs.” as seen in Figure - Edit action. All information can be updated on the “Action Information” tab, and comments can be attached as for controls and risks.
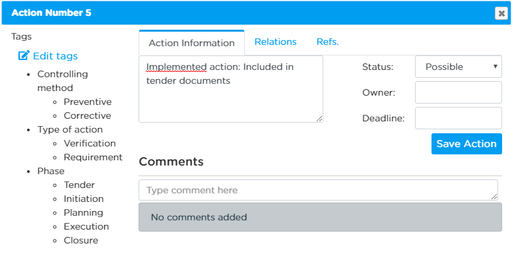
The “Relations” tab shows the relations between the actions and the controls and risks that are affected by the action. Furthermore, these also serve as links to the relevant control/risk. According to the hierarchy, the action will only be attached to one control. However, the control may affect several risks. The “Relations” tab is shown in Figure - Action relations.
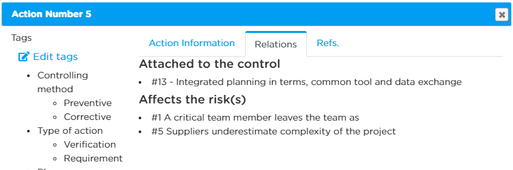
User Roles
This section gives you a general introduction to the topics:
- User Roles and their Rights
The user roles and their corresponding rights in RamRisk are given in Table - User roles. A bullet in parenthesis represent permissions grantable through the governance module, but are not on by default
| Contract Owner | Project Administrator | User | Read-only | |
|---|---|---|---|---|
| Profile page and its functionalities | • | • | • | • |
| Read risks, controls and actions | • | • | • | • |
| Comment on risks, controls and actions | • | • | • | • |
| Overview page | • | • | • | • |
| Add and edit risks, controls and actions | • | • | • | |
| Responsibility page | • | • | • | |
| Create reports | • | • | ||
| Export to Excel | • | • | ||
| Confidentiality settings | • | • | ||
| Email subscriptions settings | • | • | ||
| Change project information | • | • | ||
| Change categories and tags | • | • | ||
| Change risk targets | • | • | ||
| Add new users | • | • | ||
| Change user rights | • | • | ||
| Change groups | • | • | ||
| Create projects | • | (•) | (•) | |
| Create templates | • |
Note, that new projects can be created only by the contract owner. After the creation of a project, the project administrator can complete the setup of the projects risk register.
For details on the setting up of a project as a project administrator, see the The Admin Page.
The Overview Page
This section gives you a general introduction to the topics:
- Overview of status of Risks, Controls and Actions
- Overview of risk evaluations presented by Bar Plots
- Overview of risk evaluations presented by Value at Risk
These topics cover the functionalities of the Overview page. You enter the Overview page directly from the main menu, by clicking on “OVERVIEW”.
The Overview page consists of the page displayed in Figure - Overview page.
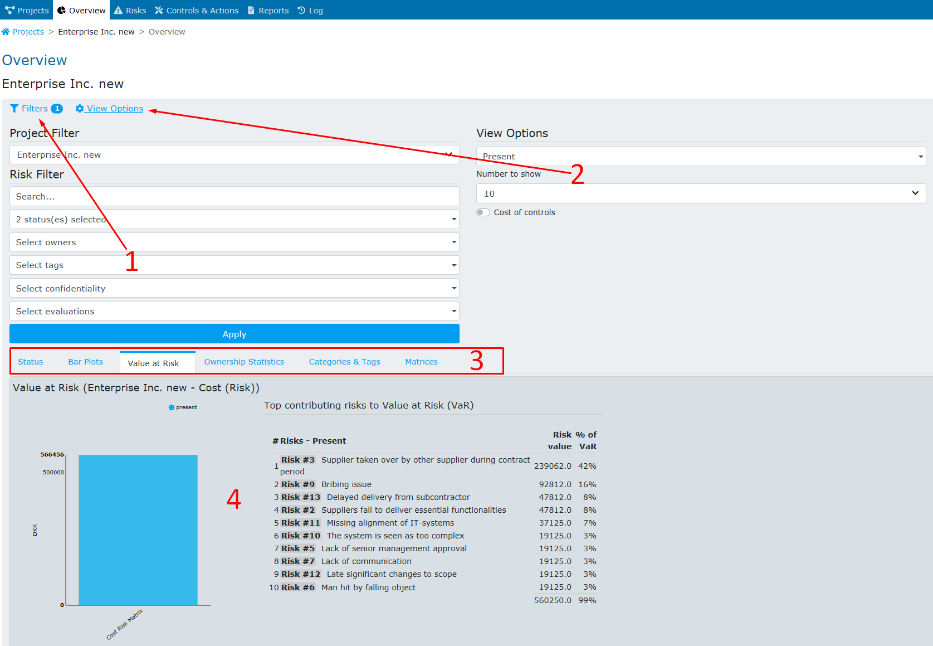
The Overview page.
Description of areas in Figure - Overview page.
[1] Filters
Project Filter
Here you must select a project (or project group) of which you want to get an overview. To select a project group to get an overview of many projects at the same time, you must have access to the module of statistics across projects, which is an additional functionality of RamRisk, see Overview Across Projects. Risk Filter Here you must select a project (or project group) of which you want to get an overview. To select a project group to get an overview of many projects at the same time, you must have access to the module of statistics across projects, which is an additional functionality of RamRisk, see Overview Across Projects.
Risk Filter
Here you can change the default filter to show a specific selection of risks. As default risks with status “New” and “Open” are selected.
[2] View Options (will only show on affected tabs)
Here you can change the evaluation type(s). As default evaluation type “Present” is selected. You can also change number to show. As default 10 is selected and will show 10 evaluations, on the overview tab that show evaluations. You can change matrix template (only available in cross-project, if matrices have same name, unit, opportunity type and explicit evaluation type.
[3] Overview Menu
Here you can choose what specific overview you wish to access.
- Status: Status of risks, controls and actions.
- Bar Plots: Risk evaluations presented by bar plots.
- Value at Risk: Risk evaluations presented by Value at Risk.
- Ownership Statistics: statistics about ownership of risks, controls and actions.
- Categories and Tags: an overview of Categories and Tags usage.
- Matrix: an overview of all the risk evaluations presented by Risk Target.
- Simulation: if enabled on your contract, it gives an overview of the Monte Carlo Simulation results based on your risk evaluations.
The specific overviews are described in detail in the following.
[4] Charts and Statistics
Here you can see the Overview requested after filtering and selecting in the Menu.
Overview of Current Status of Risks, Controls and Actions
The overview presents interactive/click-able statistics for risks, controls and actions. Pie charts illustrate the distribution on statuses; new, open etc. Bar charts illustrate the distribution on other specific features.
- For risks the bar charts show the number of risks that are/have
- Untagged
- No owner
- Unevaluated
- No controls attached
- For controls the bar charts show the number of controls that
are/have
- Overdue deadline
- Upcoming deadline
- No deadline
- No responsible
- No Cost
- For actions the bar charts show the number of actions that are/have
- Overdue deadline
- Upcoming deadline
- No deadline
- No responsible
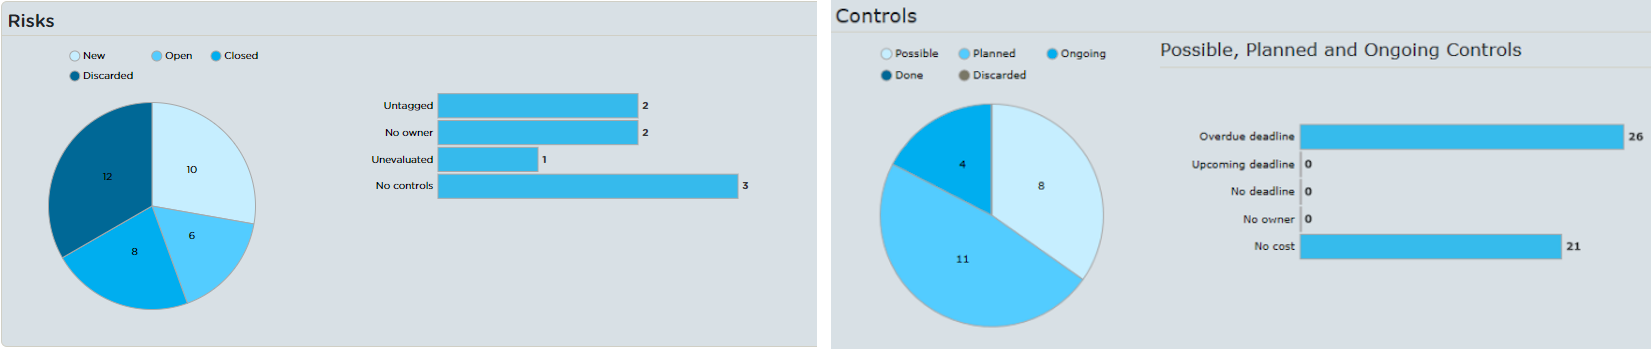
The charts are interactive/click-able in the means, that if you press the area of e.g. “Untagged Risks”, a new dialog will open displaying you the risks that are untagged, see Figure - Overview, Risk list. This view may be a very useful shortcut to find out e.g. how many and which controls have overdue deadlines.
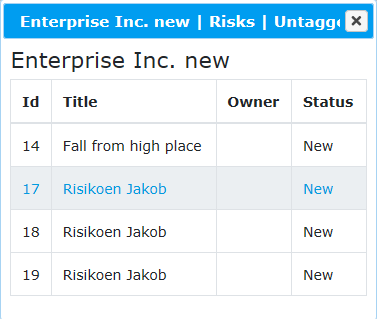
A note about the pie charts: The charts are always displayed by their distribution of statuses. In order to make sure that these pie charts always sum up to 100% and do not hide information; the user's filter on "status" is ignored. This means you can still filter by number, owner, tags, etc. and get that distribution, but the pie chart will always make a count of all statuses. In essence; even if you filter on "new" and "open", you will still see all "Done" and "Discarded".
Overview of Risk Evaluations Presented by Bar Plots
This overview presents interactive/click-able statistics for risk evaluations displayed using bar plots.
The chart displays bar plots of the number of risks on each risk target of your project.
- The bar plots are interactive/click-able in the means, that if you click on a part of the bar, a new dialog will open in the page and display you the risks given in the area that you clicked.
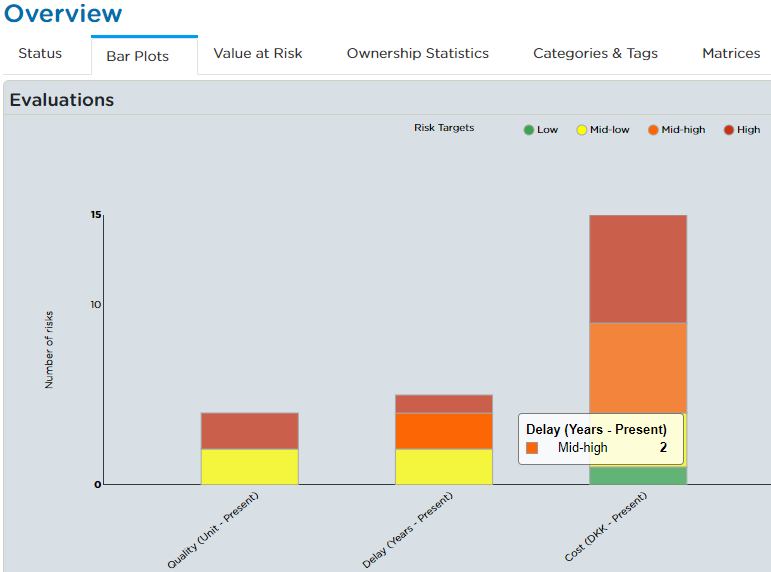
Overview of Risk Evaluations Presented by Value at Risk
This overview presents interactive/click-able statistics for the Value at Risk for every risk target, see Overview, Evaluations, Value at Risk. The chart on the left displays the Value at Risk for a given risk target. The list on the right lists the top contributors to the Value at Risk for the given risk target. The list is interactive/click-able meaning that you if you click on a risk a new tab will present the Detailed Risk page of the specific risk. When showing nett evaluations in the chart, the view option: “Cost of Controls” can be used to show/hide cost of controls.
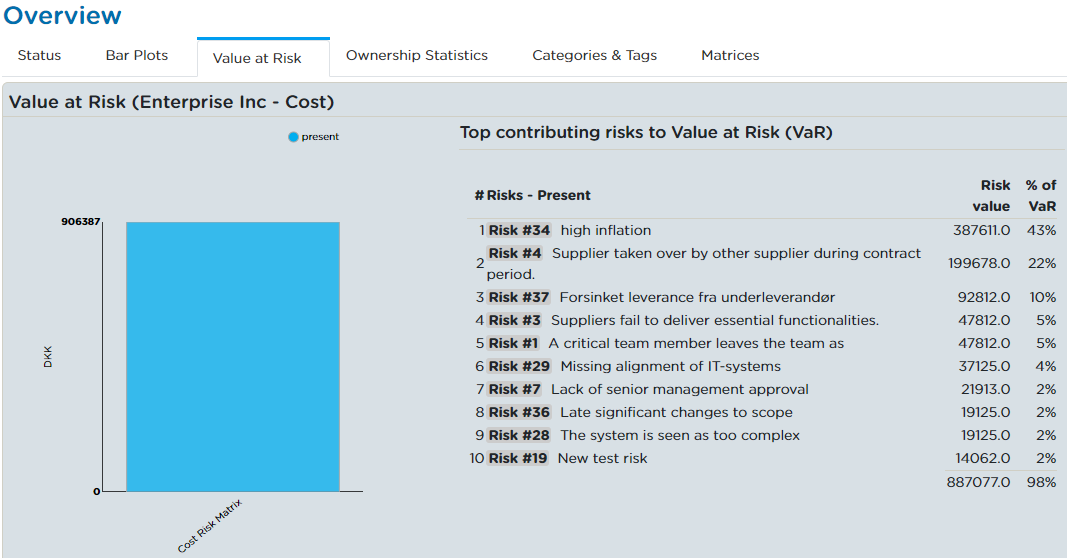
Ownership Statistics
This overview presents interactive/click-able statistics about ownerships of risks, controls and actions. Bar plots represent how many responsibilities each user is assigned to. Clicking on a bar will produce a small dialog with a list of elements that fall in that category. It is also possible to filter the content presented by clicking on the coloured labels on the top right corner to exclude/include results of that kind.
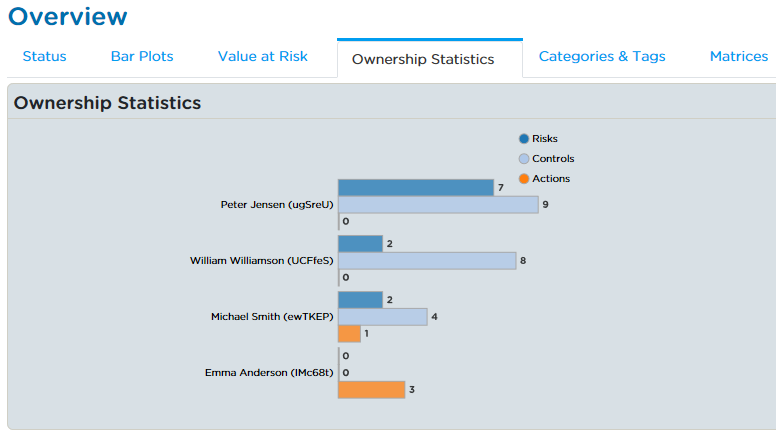
Categories and Tags
This overview presents interactive/click-able statistics about tags used on risks, controls and actions, and presented by category. The information is displayed both as a pie chart and as a bar plot displaying the number of elements that are assigned the specific tag. Clicking on a bar or on a pie section will produce a small dialog containing a list of elements that are tagged with the clicked tag.
It is also possible to filter the content presented by clicking on the coloured labels at the top of the section to exclude/include results for the specific tags.
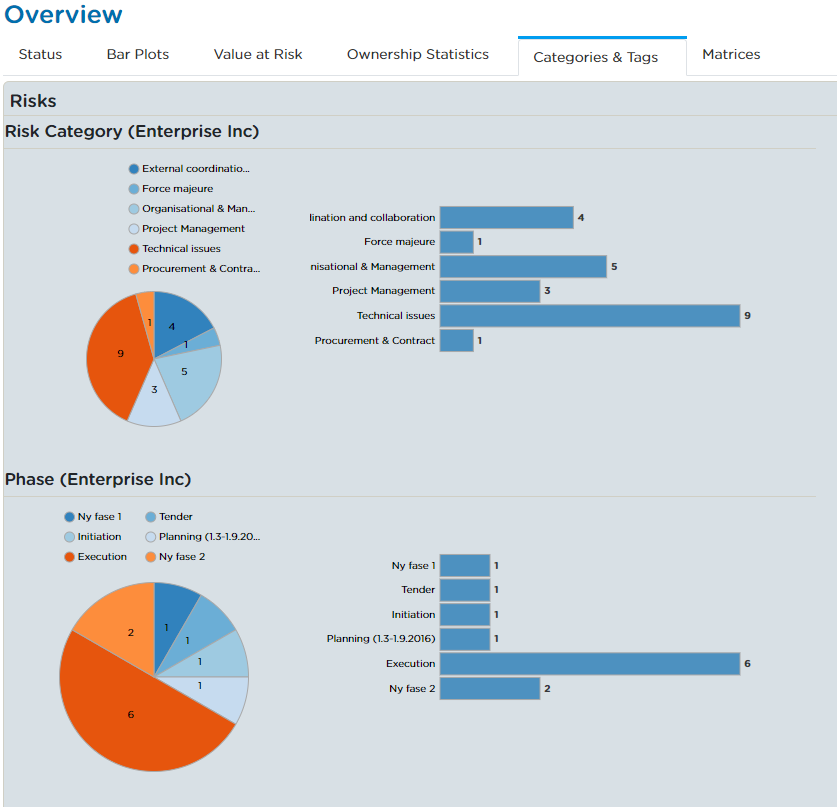
Matrix
This overview presents interactive/click-able statistics about risk evaluations for the different risk targets, presented by risk target. The chart contains the risk matrix and all the evaluations on that matrix. A list of risks evaluated on that matrix is available on the left side of the section. Clicking on a risk from the list will open a new tab on the Detailed Risk page of the specific risk, while clicking on an evaluation will produce a small dialog containing a list of risks that are evaluated in the same way.
In view options “Use quantitative matrices” can be enabled/disabled. The option will switch from qualitative vs quantitative view on the matrices that support it. Matrices will need to be set to "explicitly evaluated" to be shown as quantitative.
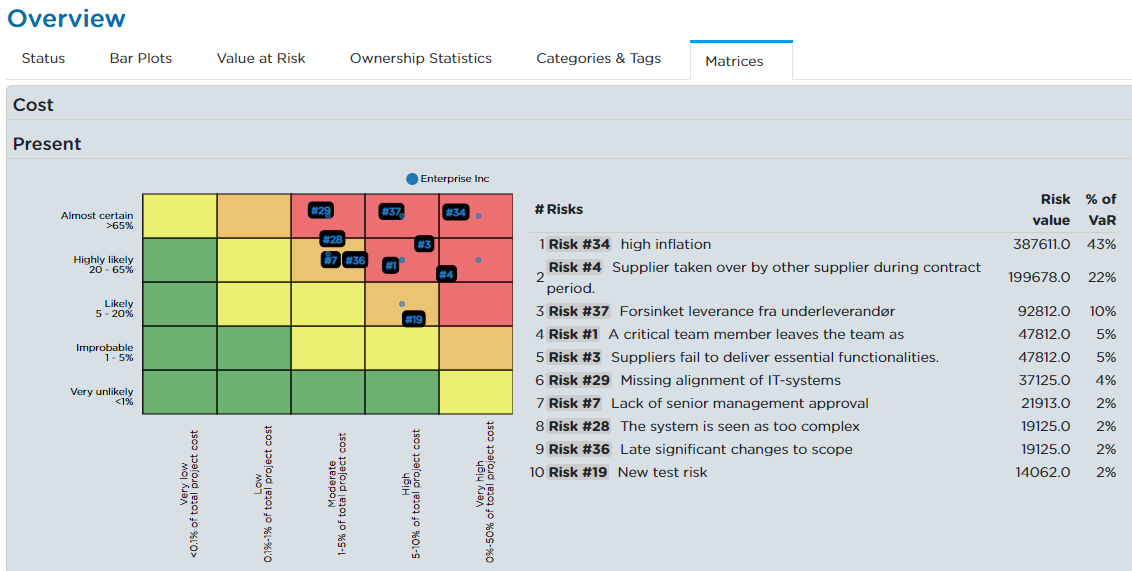
Simulation
If enabled on your contract, this overview presents Monte Carlo Simulation results based on the risk evaluations on eligible risk targets, presented by risk target and evaluation type. For more information about Monte Carlo Simulations please refer to The Reports Page. There are multiple View Options available for this tab that can be selected to customise the plots:
- Evaluation type: this option will filter the simulation plots based on the evaluation type selected
- Percentiles: this option will add/remove percentile indicators on the plots
- Matrices: this option will allow to only show relevant matrices
- Probability distribution: this option will allow to choose the probability distribution defined by the frequency and consequence values of the risk evaluations used for the simulations. It defaults to the Erlang distribution.
- Number of simulations: this option will set the number of simulations for each plot
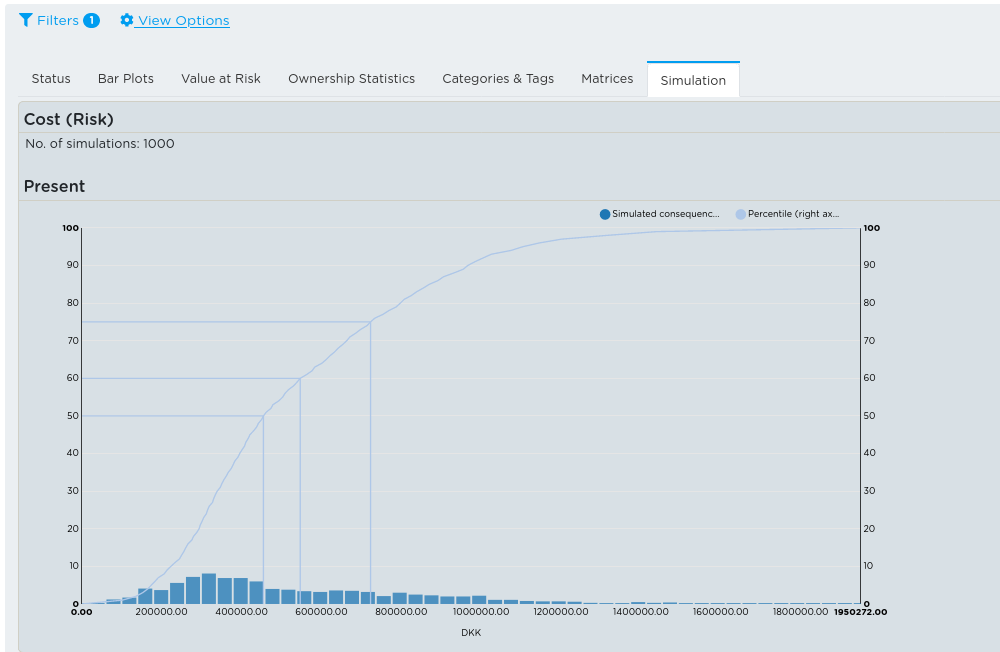
Overview Across Projects
If your contract includes the module of statistics across projects, the Overview page can present you with the above described statistics across projects. To define which projects, you wish to get an overall overview of, you must first group your projects on the Project page. Create a folder and place your projects inside. A folder can contain several projects and other folders (see Figure - Overview, Groups).
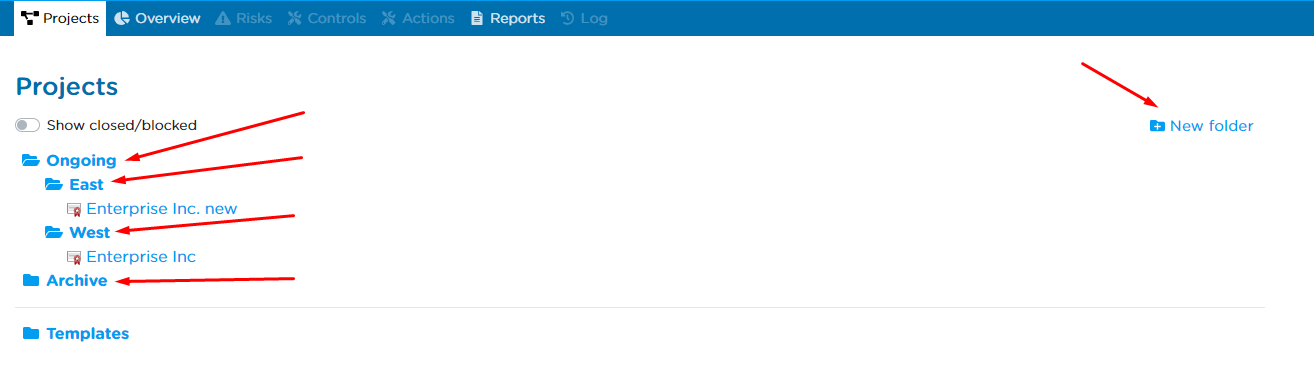
Then, you can select the project group in the Project Filter in the Overview page. An example of how Value at Risk is presented across projects is displayed in Figure - Overview, Groups, Value at Risk. Value at Risk is displayed for each project within the group on the bar chart to the left. On the right; the top contributors to the total value at risk is displayed.
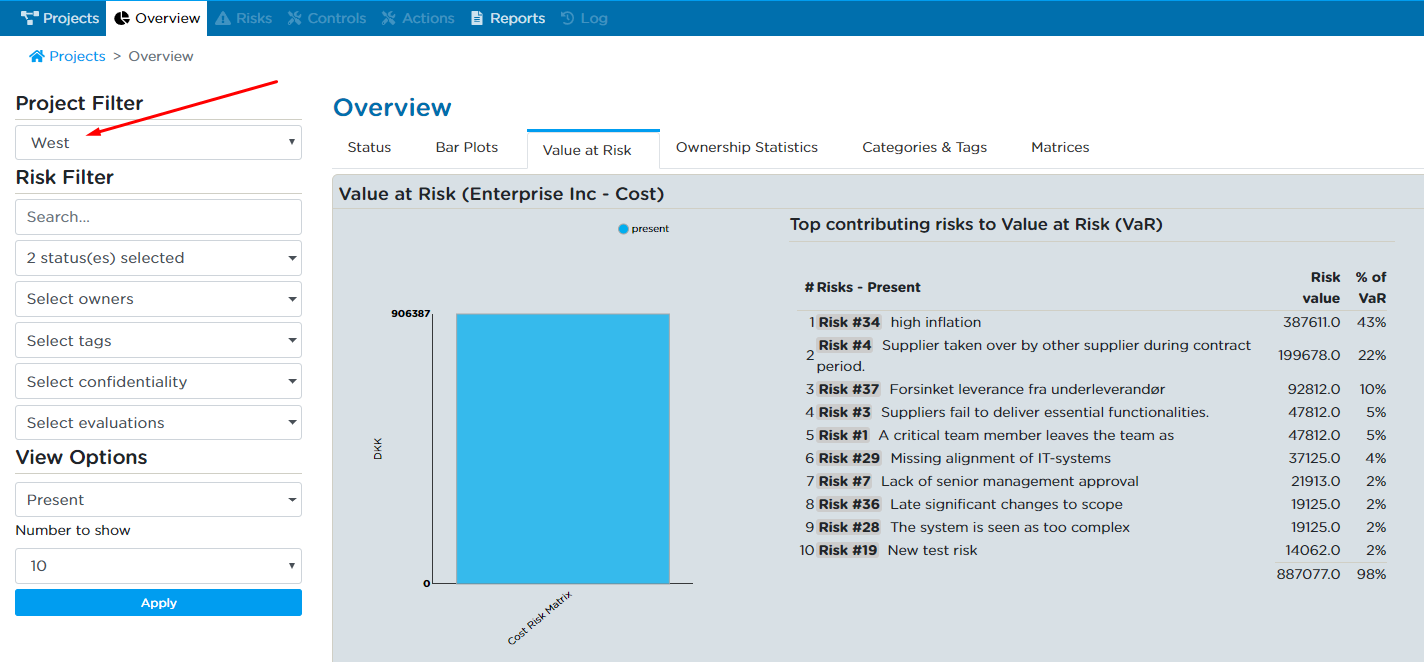
For more information on how to include overview of statistics across projects in your contract, please contact us.
The Admin Page
This section gives you a general introduction to the topics:
- Project Information
- Categories & Tags
- Risk Targets
- Custom Fields
- Users
- Remap Ownerships
- Groups
- Export to Excel/spreadsheet
These topics cover the functionalities you have access to as a project administrator. You enter the Admin page for a given project either from the Project page by clicking on “Edit project” or – once you have entered a project, from the main menu, by clicking on “ADMIN”. The Admin page consists of a menu as displayed in Figure - Admin page. From the menu, you can select which functionalities you wish to edit.
Note that the editing of functionalities only applies to the project you are currently working in.
Project Information
Here you can add or change the title (mandatory) of the project, upload a logo (optional) and add descriptive text (optional) into the categories:
- Description
- Project id
- Project phase
- Project owner
- Project manager
- Project type
- Project location
- Project finish
- Project office
- Project division
- Budget price index
- Workshop leader
- Workshop date
- Workshop participants
The project title is identical to the name of the project displayed in the Projects page. Reports of the project compiled on the Reports page always contains the title and (if uploaded) the logo. The remaining descriptive texts can be included in reports, partly or fully, or not at all, depending on what specifications you set up for the report.
Categories & Tags
Here you can edit the categories and tags for risks and controls/actions, respectively. Moreover, you can change the display order of the categories and tags by dragging and dropping.
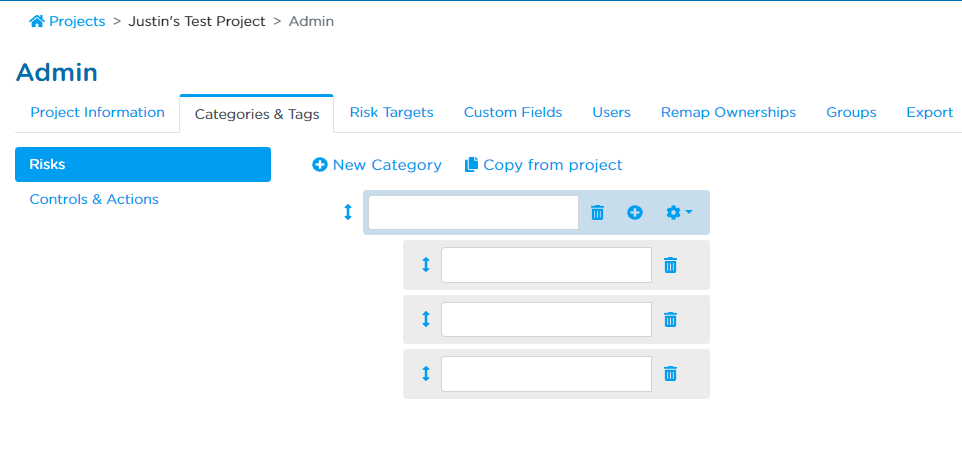
Categories and tags can be made mandatory and/or mutually exclusive in the project by clicking on the "Gear" icon, and enabling the "Mandatory" or "Mutually Exclusive" settings.
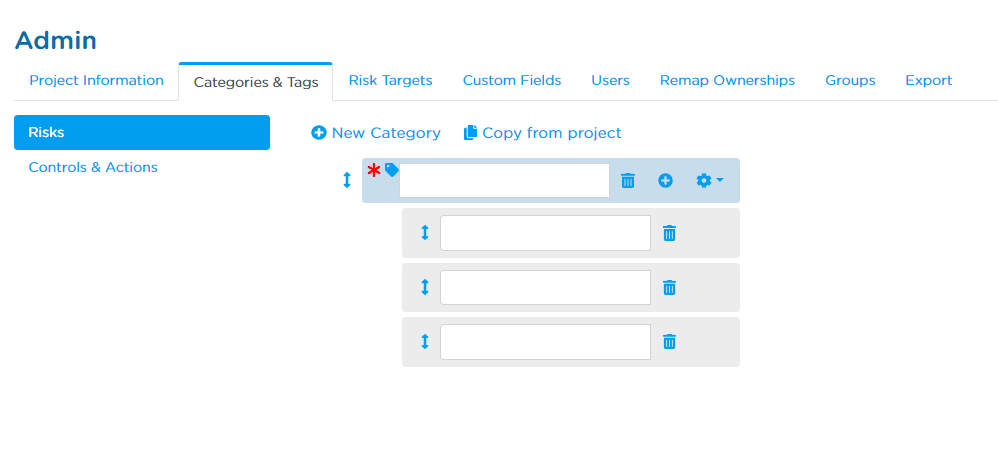
- Making a "Category" be mandatory means that each item in your project, will have to contain a tag belonging to the mandatory category. For items that don't adhere to this, you will see warnings on their detail pages and in the overview status tab.
- Making a "Category" be mutually exclusive means that only one tag from that category can be present on an item.
Risk Targets
Here you can define risk targets and set up the related risk matrices. You also have the option to copy matrices from other projects and edit them to fit your projects.
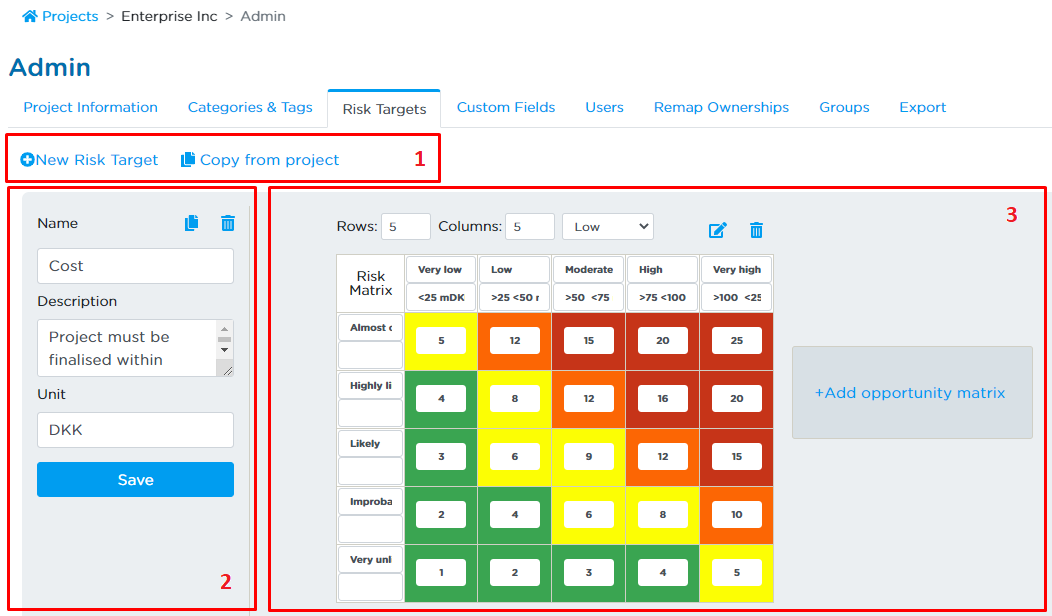
Setting up Risk Targets.
Description of areas in Figure - Edit risk targets.
[1] Adding a new risk target
You can add a new risk target either by clicking “New Risk Target” or by clicking “Copy from project”.
[2] Save risk target
Here you have the possibilities to:
- Specify a name for the risk target.
- Add a description to the risk target.
- Specify the units of the risk target.
- Copy Risk Target.
- Remove Risk Target.
[3] Edit risk target
Here you have the possibilities to:
- Change dimensions of the risk target by specifying the number of rows and columns.
- Remove the matrix. However, you are not allowed to remove the matrix, if any risks have been evaluated on it. Hence, you must remove any evaluations prior to removing the matrix.
- Add text to describe the frequency and consequence classes.
- Change the rating of each field in the matrix. Note that this rating determines the sorting of your risks in case you wish to sort according to risk level. Make sure, that you apply a logical rating, so that all green fields have ratings below the yellow fields, which again has ratings below the red fields etc.
- Change the colouring of the risk target, see below.
- Edit the frequency and consequence classes, see below.
- Add an opportunity matrix for this risk target
Changing the colouring of the fields is done by first selecting the colour, you want to apply from the drop-down menu. The options are green (low), yellow (mid-low), orange (mid-high) and red (high). Once you have selected a colour, simply click the field on which you wish to apply the colour. It is completely up to you how you wish to colour the matrix.
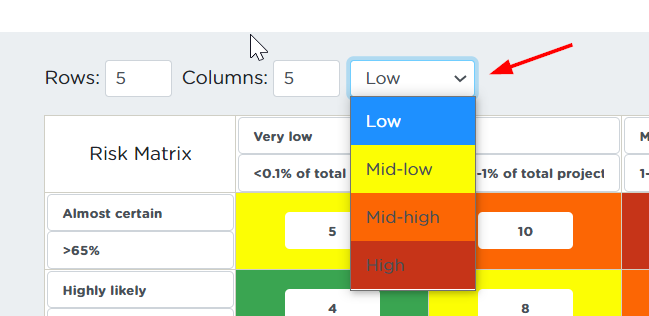
To edit the frequency and the consequence classes, click on the “Edit classes” icon. This will open a pop-up window as displayed in:
Here, firstly you must choose whether to “Use explicit risk estimation”, see Figure - Edit Frequency.

Explicit risk estimation is explained in the bottom of this table. Before that comes the description of how to edit the classes depending on the selection in “Scale consequence with budget”.
If you do not select “Scale consequence with budget”, the edit classes window looks like presented in Figure - Edit Consequence.
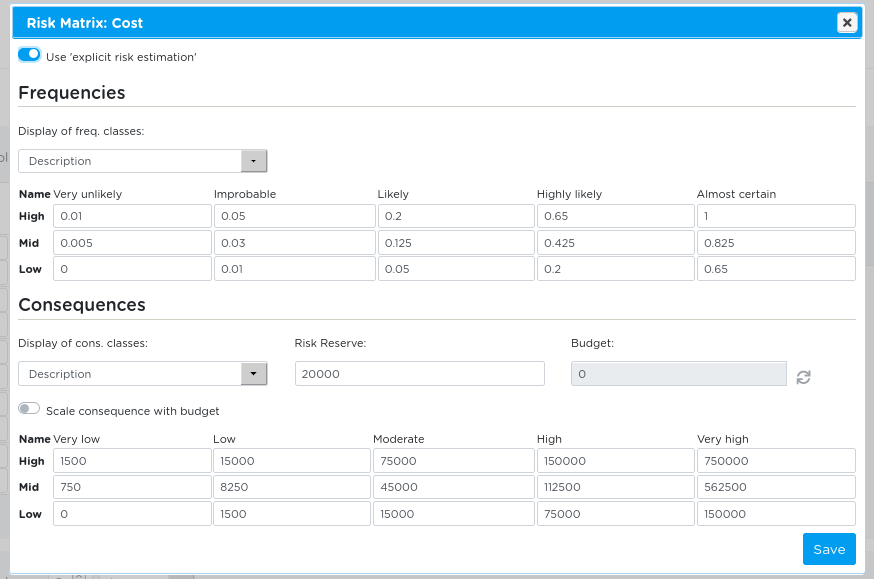
For the both frequency and consequence classes, you must specify a low, mid and high value corresponding to the 10th percentile (low), the most likely value (mid), and the 90th percentile (high) of a distribution function. RamRisk will assume an Erlang distribution for computing the risk level in "explicit evaluation" mode.
Note, you must manually update the description of the frequency and consequence classes of the risk target, see Figure - Edit risk targets area 3, after having closed the edit classes window.
If you select “Scale consequence with budget”, the edit classes window looks like presented in Figure - Edit with Scale.
Scaling consequence with budget is an option you can apply if you wish to change your consequence classes and automatically change the evaluations from the old classes to the new classes.
Alternatively, you can manually change the consequence classes (simply by editing the numbers). In both cases RamRisk will remap the location of previous evaluations to new locations if this is needed.
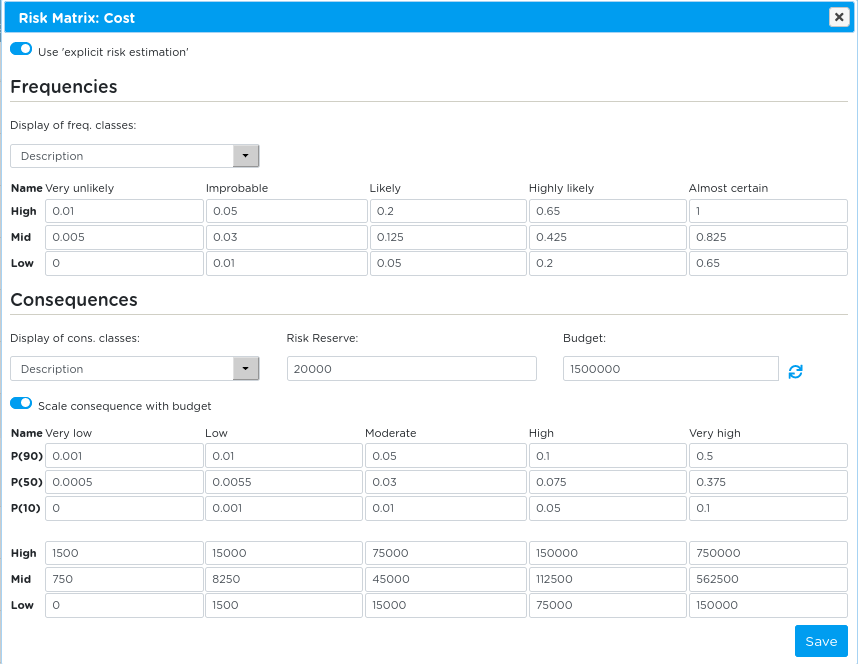
The specification of the frequency classes is done as described above: you must specify a low, mid and high value corresponding to the 10th percentile, most likely value and 90th percentile of a distribution function for each frequency class.
The specification of the consequence classes can now be done in two ways:
- As before, by specifying a low, mid and high value corresponding to the 10th percentile, most likely value and 90th percentile for each the consequence class. The values are to be written in the latter boxes of the window.
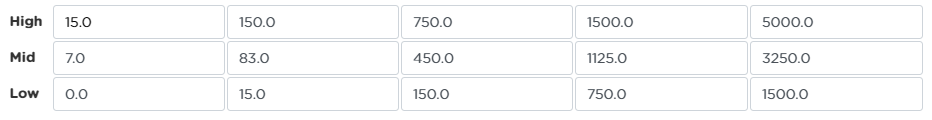
- By specifying a budget and specifying percentages of the budget for each consequence class. The resulting values of the consequence classes are then computed by clicking “Update”. Note that the values must be entered as decimals using English decimal points.
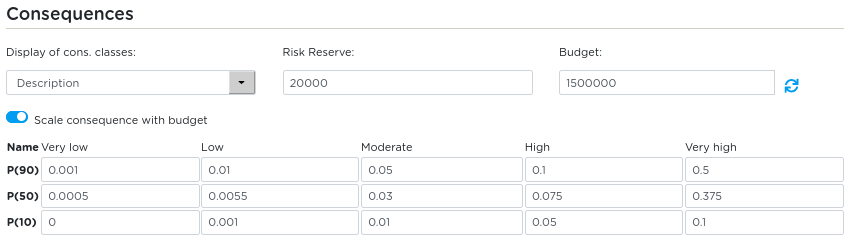
If you use approach 2, you can make manual changes to the resulting numbers before saving.
After having edited and saved the classes you may close the window. In case of having used “Scale with consequence classes” you now have the options to display the consequence classes using “Description”, “Percentiles” or “Absolute values”. Your choice is used in the presentation, when the risk matrix is shown later (both directly and in printed reports).

Explicit risk estimation affects the way users can evaluate the risks, but it has no consequence on how the classes are specified. Explicit risk estimation allows the users to evaluate the risk using 3-point estimates for the 10th percentile, most likely and 90th percentile for both frequency and consequence. The corresponding field in the matrix will then be highlighted.
The user can also choose just to evaluate frequency and consequence by clicking a field. This implies that the point estimates are automatically filled out.
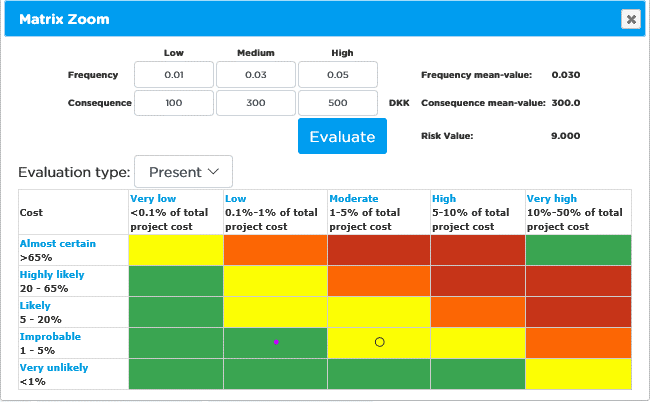
Note if you firstly have set up your project allowing for explicit estimation, and you later wish to change this, so that you do not allow for explicit estimation, all evaluations will be changed to non-explicit evaluations and the information of the explicit evaluations is not saved and cannot be recreated.
Note that the calculation of Value-at-Risk which is included in the reporting element Value-at-Risk, Tornado and S-curve depends on whether you have chosen explicit risk estimation or not.
- With explicit risk evaluation the Value-at-risk calculation uses as mean value input an estimate based on the triple estimates (low, mid and high).
- Without explicit risk evaluation the Value-at-risk calculation uses as mean value input the mid consequences directly.
It is therefore recommended to initially choose whether to apply explicit risk evaluation or not
Note that you must use explicit risk evaluation to be able to make S-curve plots.
Custom Fields
Recognising that each project may have specific requirements and processes, it is possible to extend the risk- and control- data template with additional fields for each project. When adding such additional fields, any risk or control will have these available.
For risk and controls, additional fields can be created that store data of the following types:
- Text (and list of texts)
- Number (and list of numbers)
- Dates (and list of dates)
- User (a reference to a user in the projects)
The list view
The list of Custom Fields give a quick overview of what has been added. On the left, choose between the list of Custom Fields for risks or controls in your project.
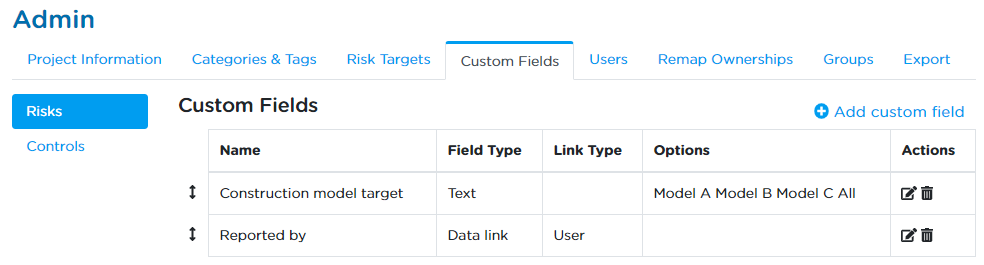
The table is broken up into five columns, as seen in Figure - Edit Custom Field:
- Name. The name of the Custom Field
- Field type. Whether it is text, date, data link, etc.
- Link type. If it is a data link; a link to what? Currently, only users are supported here
- Options. The pre-defined available options for the field, if any
- Actions. Contains buttons for editing and removing field types
You can also find handles on the left side of the list that allow you to change the order of the custom fields in the list. The order of the rows here also controls the sequence that the fields appear everywhere else. For example, see Figure - Edit risk of Custom Field for a view of the Risk page with the sample fields
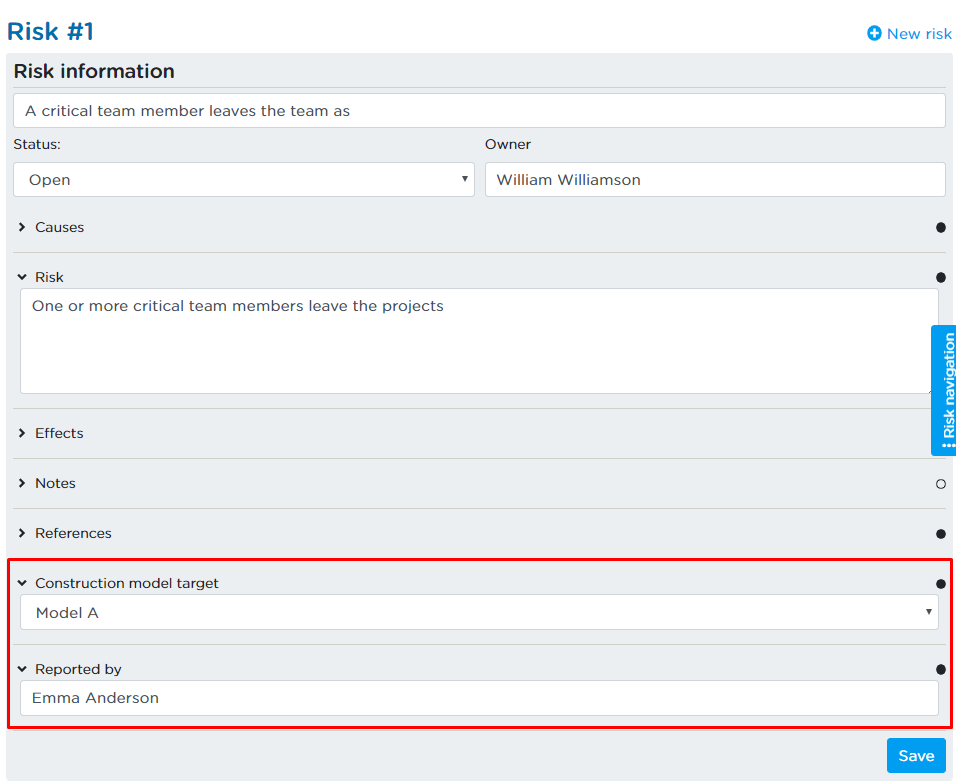
Creating a new Custom Field
Upon clicking the “Add Custom Field” button, a dialog will appear, where the information for the new field type can be entered (see Figure - Create Custom Field)
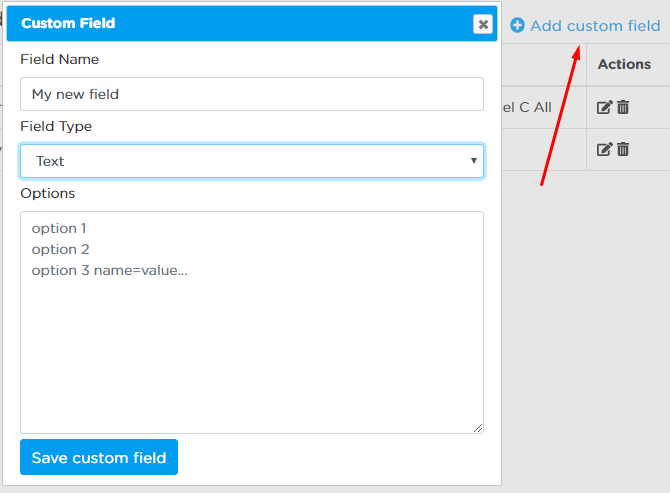
Choose the name and the type for the new field. If the “Data link” type is chosen, also specify which data type to reference (currently, only users are supported).
If the “Options” are left blank, users will be free to set any value for the fields, e.g. any text, number, or date they wish. If “Options” are set, then the values given there will be offered to the user as the only possible choices to choose from to set the value of this custom field on a risk or control.
Optionally you may include a label for each pre-defined option you specify using the “=” sign. E.g. “Q1=2020-03-31, Q2=2020-06-30, etc. When the user is setting the value for this custom field he will be presented with choices such as “Q1” and “Q2” instead of the actual values behind these labels.
Creating a Formula field
A special type of Custom field that can be defined per project is called the "Formula field".
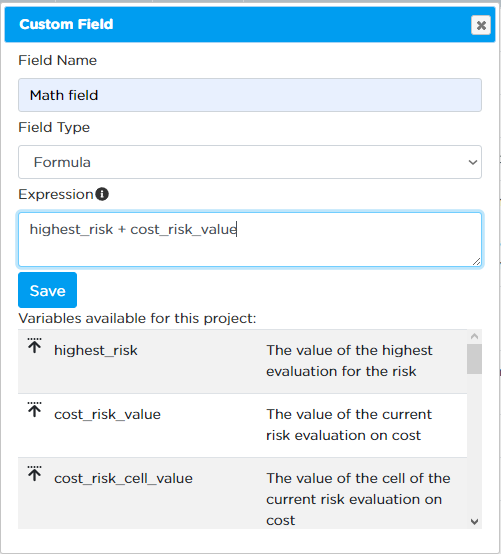
By opening the "Add custom field" menu, you can select the field type to be "Formula". For a formula field, you can define a mathematical expression by using mathematical operations and the variables that are available to the project.
Users
Here you administer the users of the project.
- Add an active user or inactive user.
- Remove an active user or inactive user, see details below.
- Activate an inactive user, thereby making him/her active.
- Setup mail subscriptions for active users, as specified in Profile Page.
- Give permission to a user to review risks.
- Enable API access
- Select roles, including rights, for active users, as specified in User Roles.
Note you cannot change the username, first name, last name, email or telephone of the users. They must do this themselves under their Profile page.
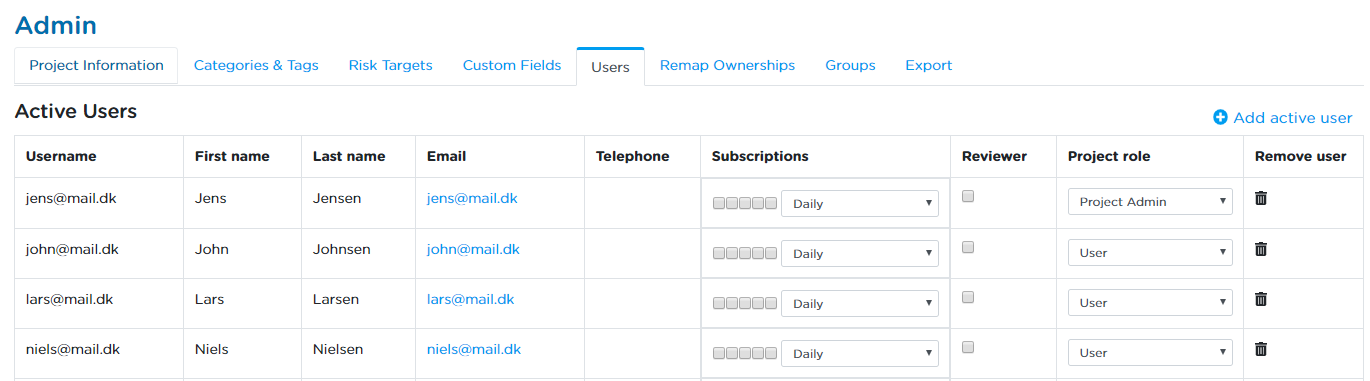
Remove an active or inactive user
When removing an inactive or active user from the system, you must remap any ownership of risks, controls and actions of the user to another user. In case the ownership can be given to only one user, this can be done automatically when removing the given user. In case the ownership is to be distributed to more than one user, this can be done manually by changing the owner of the relevant risks, controls or actions, e.g. from the Remap Ownerships page.
Remap Ownerships
Here you can transfer ownerships of all the risks, controls and actions within the project. In this tab, it is possible to select a user from whom to transfer ownerships to others. Having inserted this user in the “From user” box, a list of the risks, controls and actions assigned to him/her is available to select from. All elements can be filtered by status from the menu on the top left corner. To transfer ownership of an element, select the element to remap by clicking on the checkbox to the left. Multiple elements can be transferred at once. After a second user is inserted in the “To user” box, it is possible to reassign the selected ownership(s) by clicking on the “Reassign” button.
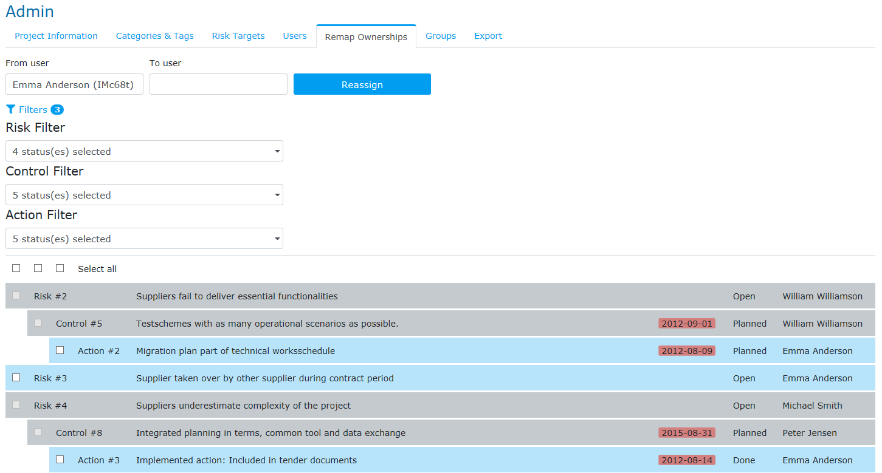
Groups
Here you can group your users. This must be done in case you need to make use of the confidentiality functionality, which allows a given risk to be visible to only a selection of the users of the project.
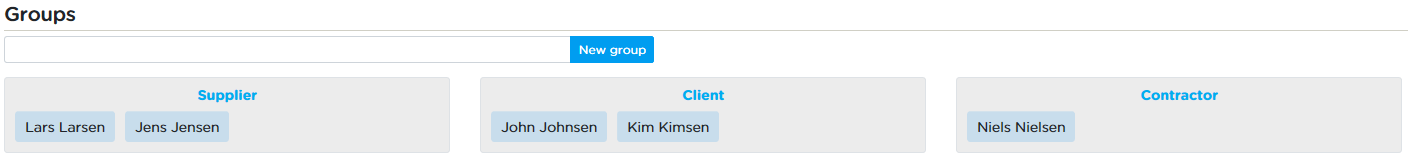
In case you need to appoint the organisational ownership of risks, you should not use the group functionality for this, but create the appropriate category and tags. The reason for this is that filtering and reporting of risks can be done using tags, not groups.
Default Confidentiality settings
Default confidentiality settings can be enabled from the ADMIN section under the “Groups” tab. With this it is possible to choose default groups for risk confidentiality, such that all new risks are confidential from the time they are created. The feature can only be enabled, when all users in the project belong to a group.
The feature gives the Administrator of a project the option to define that the risk is
- confidential to the group, the user creating the risk belongs to
- additionally, confidential to one or more groups defined by the Admin.
As an example; two different groups are created in a project: “Client” and “Contractor”. If the user belongs to the “Contractor” group, and the feature is enabled, all new risks created by the user will be confidential to the “Contractor” group (meaning only users in the “Contractor” groups can access them).
If “Defaults groups” are additionally set up, e.g., the “Client” group is chosen per default, this means that all new risks will be accessible to users from the “Client” group. This is to ensure that one party can always access all risks. In order to ensure the state of this, default groups cannot be removed from the confidentiality settings for specific risks, i.e., in the given example the “Client” group cannot be unchecked afterwards.
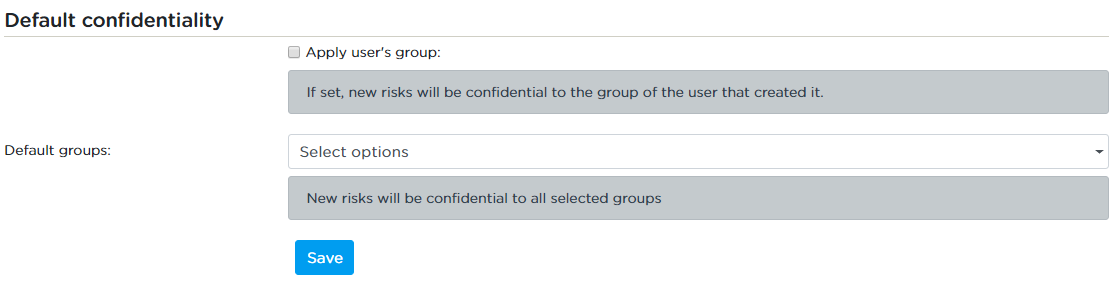
Click “Select options” and this will appear:
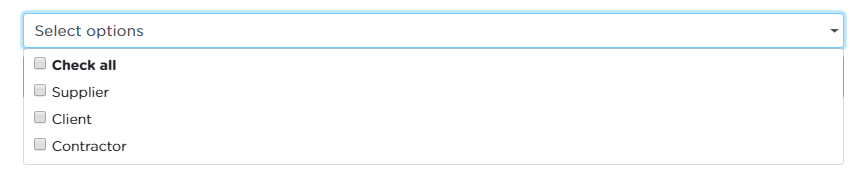
When these settings are enabled, users will see information about confidentiality settings when creating a new risk, so they know who can access the risk.
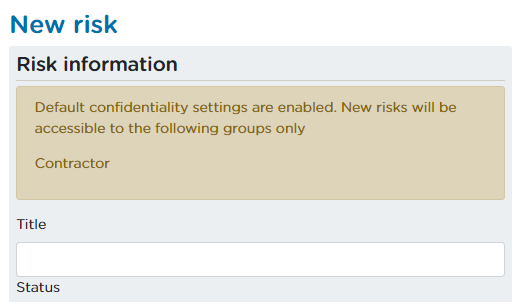
Furthermore, a user can not remove the group he or she belongs to from the confidentiality settings for a risk. This is done to ensure that the user cannot be “locked out” and hence cannot access the risk.
Export to Excel/spreadsheet
All data from a project in the system can be exported to a spreadsheet in Excel-format. Data to be exported can be chosen from 8 different groups: risks, controls, actions, risks/controls/actions (combined), log, comments, matrices and references. Each group is exported to a sheet in the file.
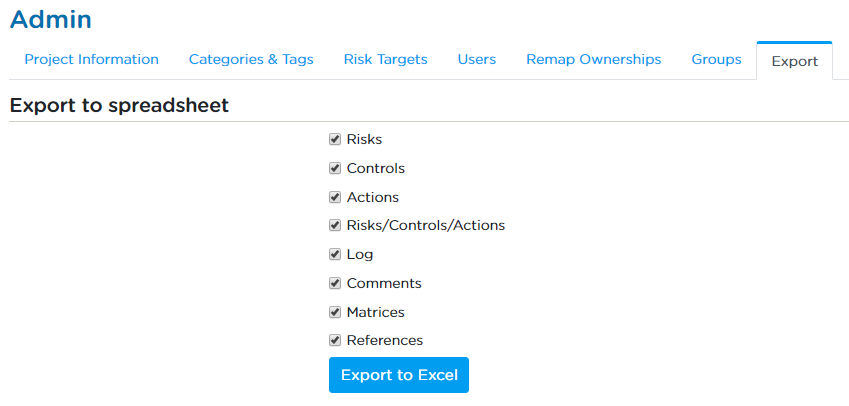
Contract Owner
This section gives you a general introduction to the topics:
- The Contract Summary
- Adding a New Project
- Creating a New Project Template
- Open/close Existing Projects
These topics cover the functionalities you have access to as a Contract Owner. You enter the Contract Summary from the Project page by clicking on “View Contracts”. The Project page is accessed from the main menu, by clicking on “PROJECTS”. Contract Owner View for the Contract Owner displays the structure of the view for the Contract Owner and the table below presents the functionalities.
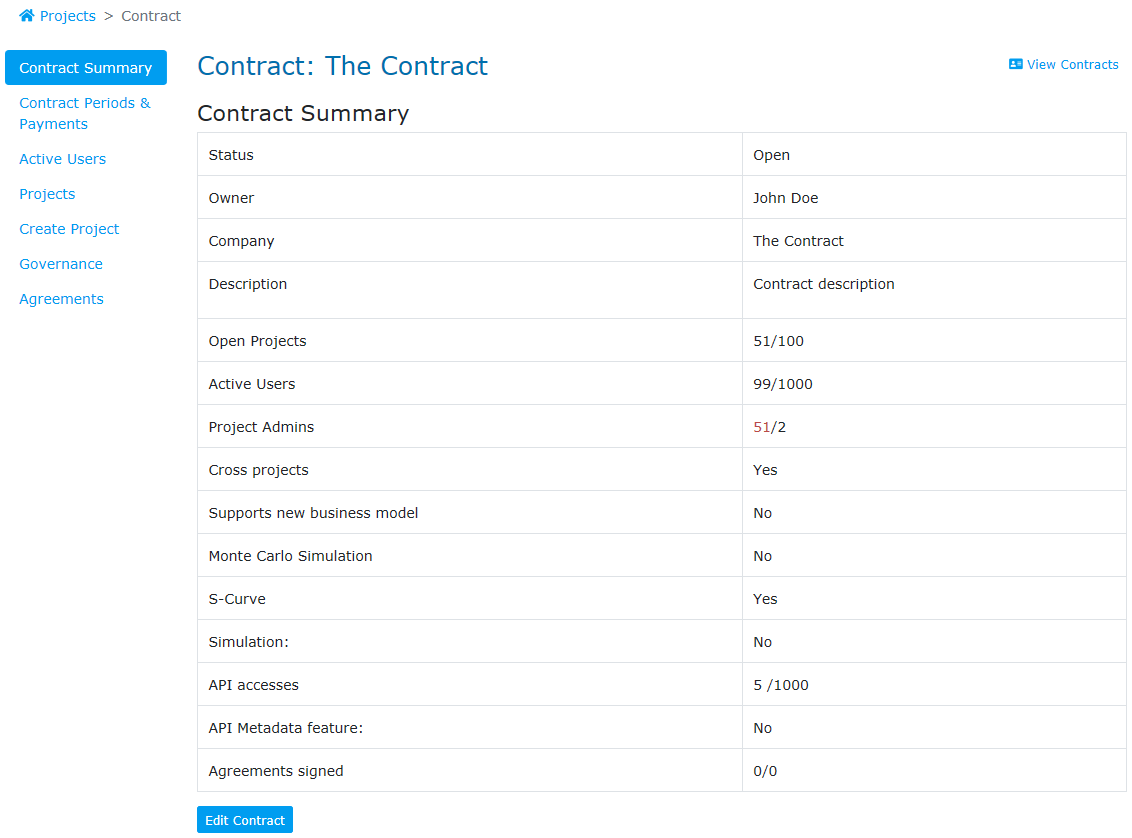
The Contract Owner view.
Description of areas in Contract Owner View for the Contract Owner.
1. The Contract Menu
As contract owner you have the possibilities to access
- Contract Summary
- Contract Periods & Payments
- Active Users
- Projects
- Create Project
- Governance
- Agreements
2. This area reflects the selected item in the menu.
Contract Summary
The summary presents an overview of the status of the contract (open, closed), the number of open projects (number of open project / allowed number of projects in contract), the number of active users (number of active users / allowed number of active users in contract), the number of project administrators (number / allowed number in contract) and whether the contract includes the module of statistics across projects.
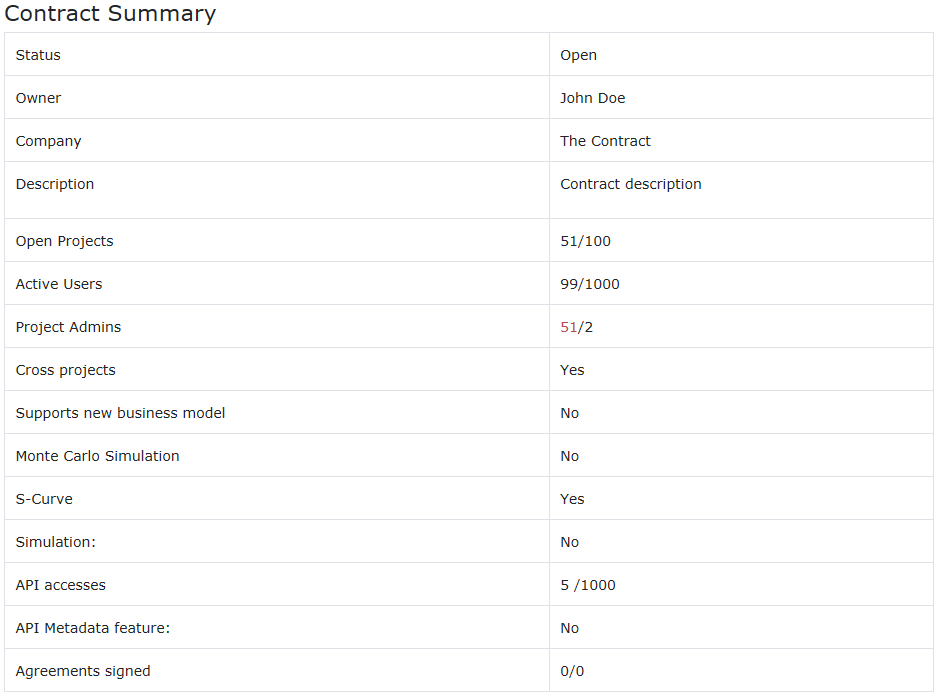
Contract Periods
In this table the payment periods are displayed together with amount and payment status.
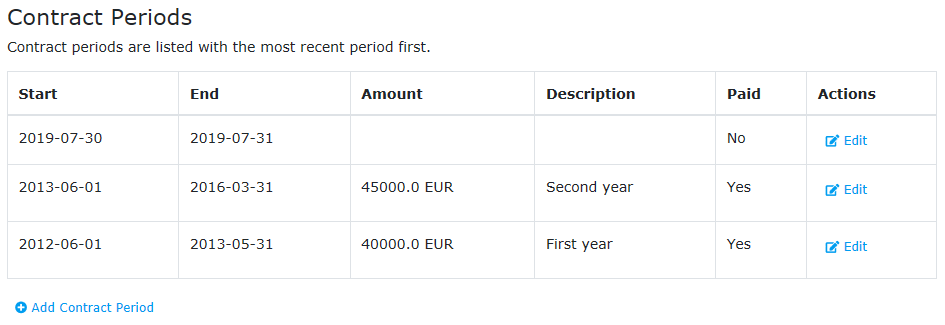
Active Users
Here is presented the contact information of the active users assigned to projects within the contract.
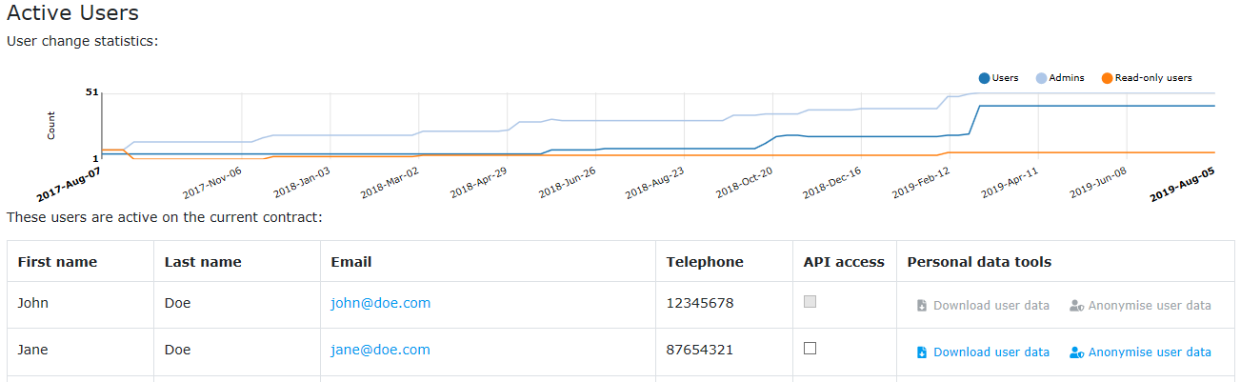
GDPR
Now that GDPR has come in effect, it is important for our clients to have the tools they need to stay compliant. To that end, two new features have been added for contract owners to leverage: Download of user data as well as Anonymisation of users. If a user wants to know what data that relate to them, they can ask their contract owner to fetch these data. In addition, if a user wants to be forgotten from RamRisk, they can put a request to the contract owner, who can now anonymise their data. The outcome of this is that all personally identifiable data will be replaced with random characters, such that there is no longer any reference to the individual. Keep in mind that if a user is active on more than one contract, the user will need to request anonymisation from each of these contracts\' owners to completely forgotten from the system.
As a contract owner, you have the option of reassigning responsibilities from one user to another.
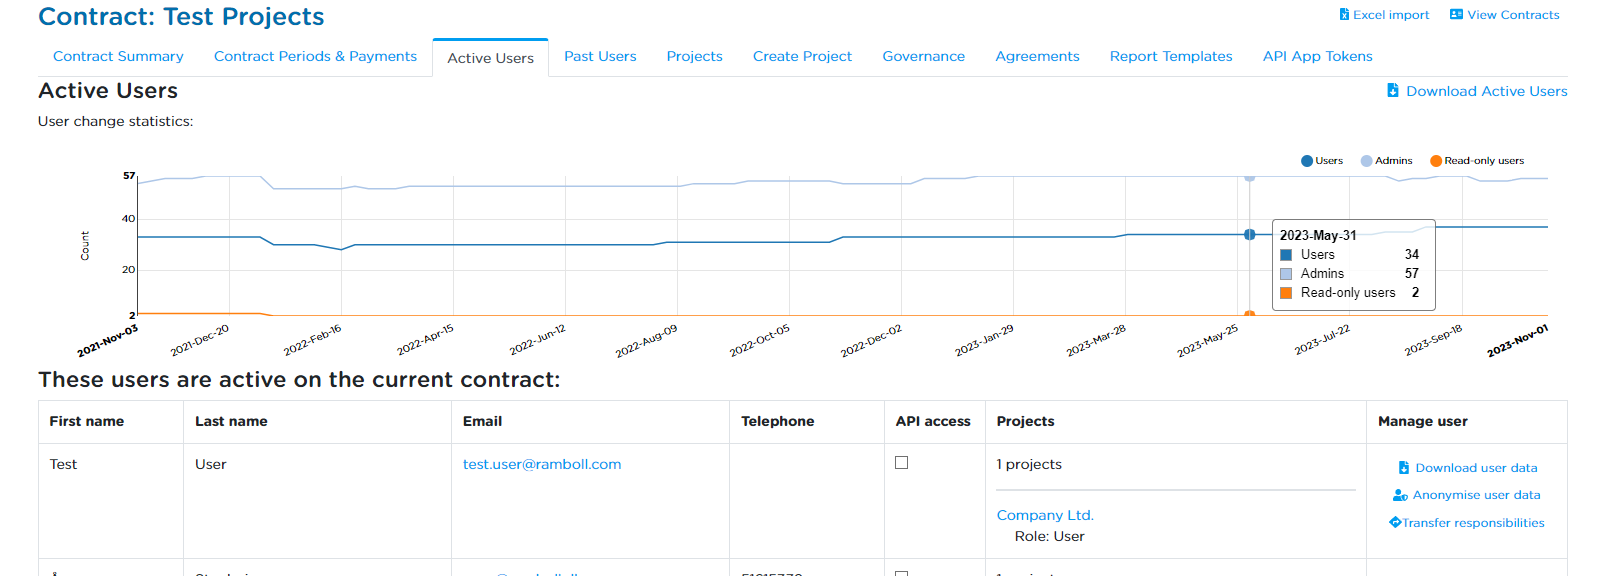
To do this, go to the user you want to transfer the responsibilities from, in the "Active users" Tab. On the right side of the row, you will have a link called "Transfer responsibilities". After clicking the link, you will be redirected to a different page.
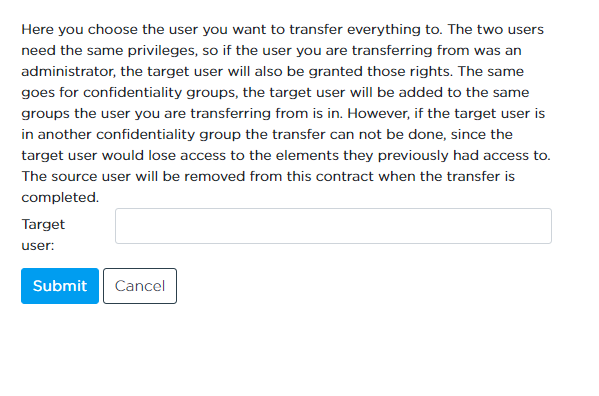
In the transfer responsibilities view you will be asked to select the user to which the responsibilities will be reassigned. Input the target user and click "Submit". Once this is done, the target user will now have all the responsibilities that, the original user had.
API
If your contract has purchased access to the RamRisk API you can enable access for users here. If you do not have API access currently, please reach out to RamRisk support to arrange getting access. The API allows you to access your RamRisk data from other platforms such as Microsoft's PowerBI and similar. Figure - Active Users on Contract.
Projects
In this table is displayed the projects within the contract together with the number of active and inactive users. For the active users, the names of the users are displayed.
A project is per default “Open” for editing and managing. In case the project is changed to “Closed” the project becomes read-only. The information of the project can be extracted, but no changes can be made to the project. Moreover, the number of active users of a read-only project does not count in the number of active users.
As a contract owner you can join projects, in which you are not currently a user.
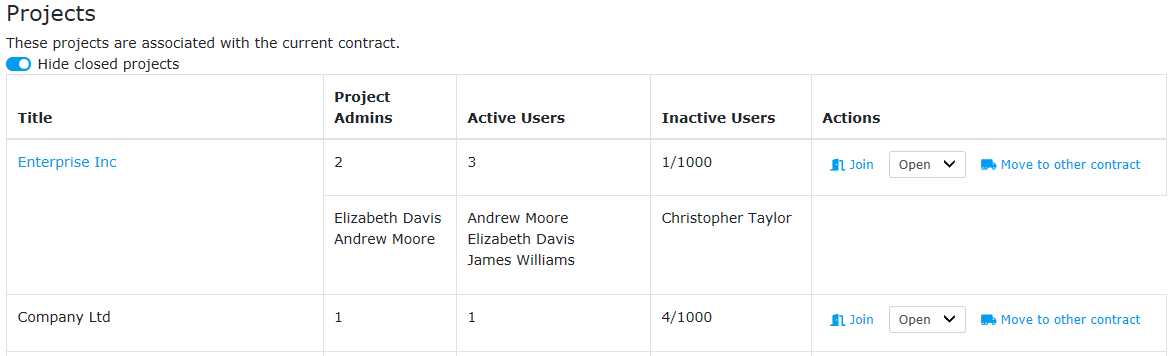
Create Project
When adding a new project to your contract, you must specify the title. In addition to this, you can choose to add a variety of other information such as project description, logo, manager, location and much more. You can always edit the title, information and logo in the Admin page of the project, see Admin page.
If you click “Make this a project template”, your project will be a template. A template is accessible for all users assigned to projects in your contract. The users may copy risks, controls, tags, risk targets etc. from the template to their projects. Hence, the template can be set up to inspire to best practice etc.
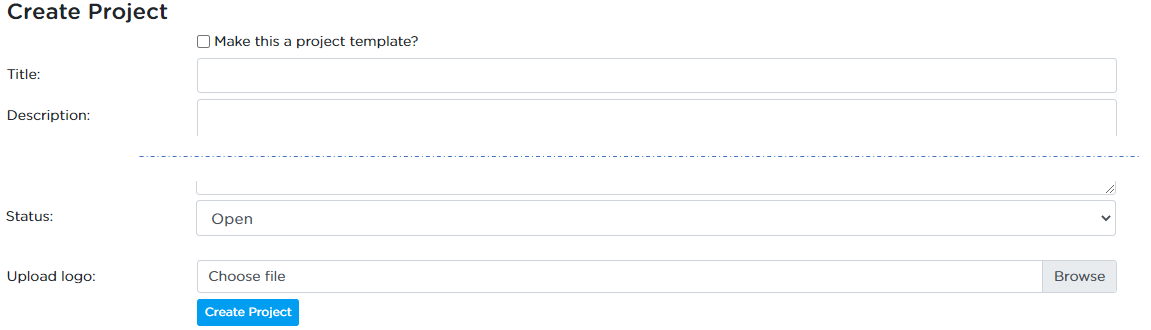
Governance
When dealing with many projects in an organisation it is very nice to be able to describe which rules these projects must follow. To help users get in control, a new section has been added to the contract page, where contract owners can setup rules for all projects under the contracts.
For now, there are two types of rules:
- Permissions, that can be assigned to specific user types
- Enterprise rules that affect how projects behave
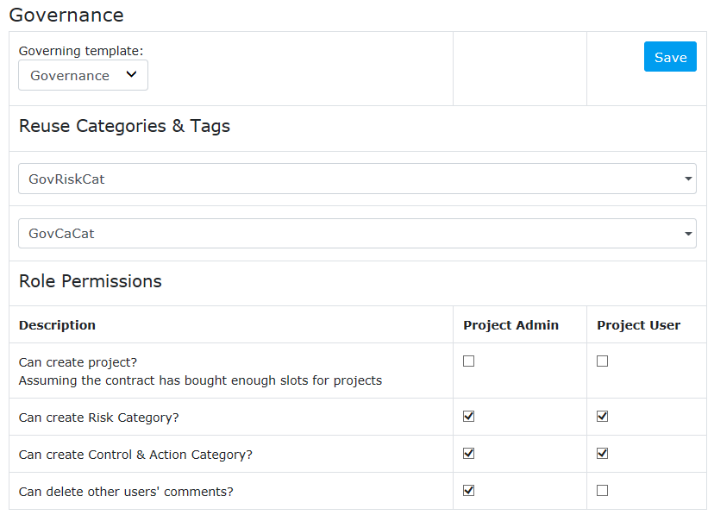
Specifically, it is now possible to determine who can create projects, create and modify categories and tags, and who can delete other users\' comments. For the Enterprise rules, it is possible to define a Template (a Governing Template), whose categories can be shared to work across projects on the same contract. This lets all users on the projects apply categories from the Governing Template and filter their searches and report elements by these shared tags.
Agreements
Agreements between Rambøll Denmark and customer will be listed in this table. A contract owner will have the option to accept the agreement, by opening the agreement (Figure - List of Agreements) and clicking the Accept button as shown in Figure - Sample Agreement.
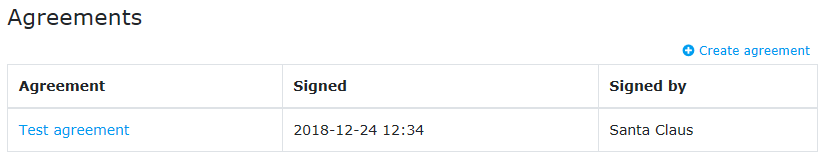
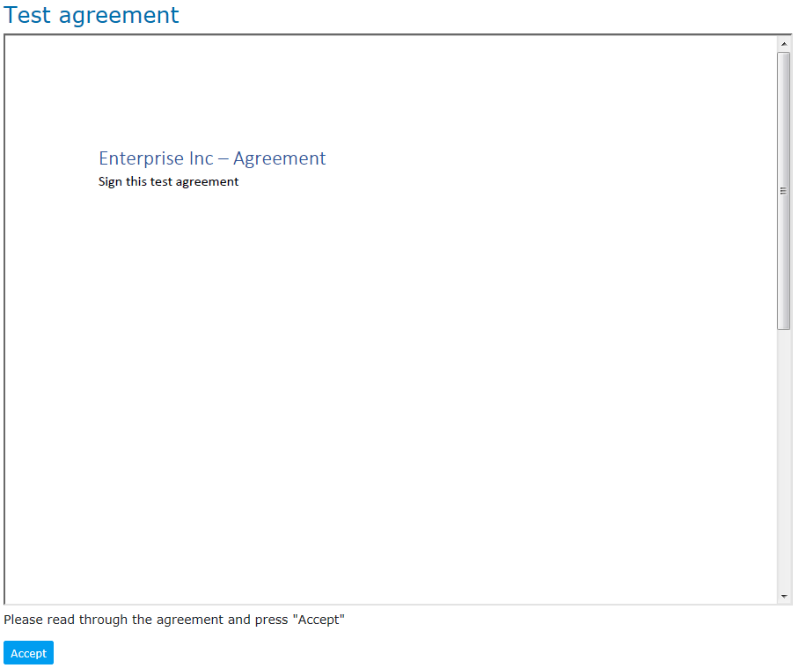
Terminology
The terminology of RamRisk follows the main lines of ISO 31000 “Risk management – Principles and Guidelines”. The following main terms are important:
Risk: An uncertain effect on the project's risk targets. That is, events that may occur and have uncertain (positive or negative) effect on formulated risk targets such as economy, time and fatalities. The main risk description is also in RamRisk termed “risk”.
Risk Target: The targets that risks are identified in relation to. Typically, one risk matrix and/or one opportunity matrix is connected to each risk target. Example of typically chosen risk targets are: Cost, time, quality etc.
Causes: A description of the causes for a risk to occur.
Effect: A description of the potential effects if a risk occurs.
Notes: Risk notes that can be included in the reports. Typically used for a brief status on the controls.
Risk Matrix: A matrix with frequency of occurrence along the vertical axis and severity of consequences along the horizontal axis. A risk matrix can be defined for each formulated risk target, e.g. cost and time.
Opportunity Matrix: A matrix with frequency of occurrence along the vertical axis and size of opportunity along the horizontal axis. An opportunity matrix can be defined for each formulated risk target; e.g. cost and time.
Control: A description of a measure to be taken to control a risk. Controls are sometimes also called risk reducing measures, mitigations or risk control options. Controls may be formulated as specific actions to be carried out, or as overall measures such as “contact to relevant authorities” requiring several related actions to be carried out.
Actions: Specific actions related to a given control, i.e. actions that must be carried out to handle a more generally formulated control.
Category/Tags: Risks can be tagged according to lists of tags. The tags are grouped in categories.
RamRisk API Manual
Version March 2026
Rambøll
Hannemanns Allé 53
DK-2300 København S
T +45 5161 1000
F +45 5161 1001
www.ramboll.dk
For further information, please contact support@ramrisk.com
The newest version of this manual can be downloaded from ramrisk.com
Introduction
The RamRisk API gives access to RamRisk data through a simple RESTful service, allowing for application developers to benefit from the platform in any way they want, be it for quick access to responsibilities of users or completely recreating the frontend to suit other business needs.
What you get is the structure and underlying math of the RamRisk system available in its simplest form.
Structure of this document
This document is made up of a few topics that are general for the entire API followed by a description of all the available resources. A resource is an object that can be retrieved and/or modified using the API. Examples of resources are Risks, Evaluations, Tags, etc.
Each resource has its own section. Sections for resources can be expected to have the following structure:
- Explanation of the resource and how it fits into the domain
- A table describing each attribute of the resource
- A full example of what the resource could look like
- Descriptions of each API endpoint that has to do with the resource, as well as how to use it
An "endpoint" is a URL location in the API. An endpoint may describe a resource, a list of resources or an action that can be performed on a resource or list of resources.
Versioning and deprecation
RamRisk is being continuously developed, which means performance improvements and bugfixes as well as new features are released all the time. Along with those, however, may come changes to the system that may affect the API. In order to minimize problems for API consumers, we make sure to version the service such that we can avoid releasing backwards-incompatible changes that will break consumers' code.
Each version of the API may have an expiry date specified. An API version will be deprecated at latest 6 months before becoming unavailable, giving consumers ample time to adjust their code to the new version.
Currently there are two available versions of the API, version 1 and version 2. The version of the api is specified in the url of the request, where "v1" is included for version 1, and "v2" for version 2.
Example:
GET /api/v1/projects/is a request directed at version 1 of the APIGET /api/v2/projects/is a request directed at version 2
Unless specified differently in the specific endpoint section, v1 and v2 endpoints will both be available and their results will match. All v1 endpoints have a respective v2 endpoint unless specified differently.
Authentication
To get access to the API, the consumer is required to authenticate himself. This is important, so we can check whether the consumer is allowed access and to which projects.
In order to authenticate with the API, the consumer needs to provide basic token authentication, which means the user needs to specify an API token for each request made to the API. The API key is generated from the user profile page once the contract owner (or administrator) has granted the permission to access the API for the contract. In addition, the token can be retrieved by using the API, and providing username and password like in the following example:
>>>>
POST /api/api-token-auth/
Content-Type: application/json
Accept: application/json

{
    "username": "bob@example",
    "password": "bob123password"
}

<<<<
200 OK
Content-Type: application/json
{
    "token": "[...]",
}
The token should be provided in the HTTP header Authorization and
should be formatted like this Token 383290f1y20359f14701f23, that is,
the capitalized word "Token" followed by a space, followed by the
token string.
Authorization
Once you provide the correct authentication credentials, you can to
access the API endpoints. An important detail is that you may not be
able to access all the same data, that you can access from the
RamRisk website. API access is assigned to users per project, which
means you can only access project data from the projects, where you have
had API access enabled. For example, if you have a project role on
projects A and B, and you have only been granted API access on
project A, then only data from project A will be available through
the API.
Data resources and discoverability
The API resources are structured around the models that are already familiar to RamRisk users, like Risks, Controls, Tags, Evaluations, etc. Each resource is documented in the sections below. All endpoints accept the OPTIONS HTTP verb, which provides information on what can be sent to the endpoint.
As is standard in RESTful APIs, the resource endpoints are divided into
two main groups: collections (/api/v1/projects) and single objects
(/api/v1/projects/1). The single objects are represented by a single
JSON object inside curly brackets ({"foo": "bar"}), which is
simple, but the collections are not simply lists of those.
In order to preserve performance of the API as well as giving the implementers a way to fetch only what is needed, the collection endpoints are paginated. This means that whenever a collection resource is queried, the entire collection will not be fetched; only a page of the collection. The data will be formatted as a JSON object like the following
{
  "count": 143,
  // The amount of objects in the full collection,
  "previous": null,
  // The link to the previous page, if any
  "next": "/api/v1/projects?page=2",
  // The link to the next page, if any
  "results": [
    // The list of objects in the page
    ...
  ]
}
The page size is limited by default to 100 objects. This can be
controlled by specifying the page_size parameter in the URL. The
parameter page, together with page_size, allows full customization
of the pagination options. It is also possible to disable pagination on
request, by setting ?page_size=0. This will request all the results to
be returned on the same page.
Example:
To return the results number 11 to 20 while querying projects:
GET /api/v1/projects?page=2&page_size=10
Collections of objects returned from most of the entry points can be
sorted to any of the fields. The query parameter that allows sorting is
called ordering, and it can be used to specify a list of comma
separated fields in respect to which results are ordered. Results can be
ordered both in ascending and descending order. The default order will
be ascending, while for sorting in descending order one needs to prepend
a '-' in front of the field name.
Example:
To return risks sorted by descending status but ascending title, the request is as follows:
GET /api/v1/projects/1/risks?ordering=-status,title
Resources
Project
All core information about a project
Structure
A Project is made up of the following parts:
| Name | Type | Read-Only | Required | Comment |
|---|---|---|---|---|
| id | integer | yes | The id of the project | |
| contract | integer | yes | The id of the contract that has this project | |
| title | string | yes | The title of the project | |
| date | datetime | yes | The date when the project was created | |
| description | string | yes | The description of the project | |
| project_id | string | yes | A textual identification of the project | |
| project_phase | string | yes | The phase of the project (textual) | |
| project_owner | string | yes | The owner of this project | |
| project_manager | string | yes | The manager for this project | |
| project_type | string | yes | A textual indication of the type of the project | |
| project_location | string | yes | A textual indication of the project's location | |
| project_office | string | yes | A textual indication of the project's office | |
| project_division | string | yes | A textual indication of the project's division | |
| budget_price_index | string | yes | The budget price index for the project | |
| project_finish | string | yes | A textual indication of the project's finishing date | |
| workshop_leader | string | yes | The leader of the workshop (if applicable) | |
| workshop_date | string | yes | The date the workshop (if applicable) | |
| workshop_participants | string | yes | The participants to the workshop (if applicable) | |
| status | integer | yes | The status code for the project * 10 = Open * 20 = Closed |
|
| type | integer | yes | The type code for the project * 10 = Project * 20 = Free trial Project * 30 Template |
|
| created_at | datetime | yes | The date and time that the project was created | |
| created_by | integer | yes | The id of the user that created the project | |
| updated_by | integer | yes | The id of the user that last updated the project | |
| sys_period | datetime range | yes | The time range in which this revision of the project is valid. An open-ended range marks that this is the current revision |
Example:
{
  "id": 1234,
  "contract": 123,
  "title": "Project Example",
  "date": "2018-01-01 12:00:00.00000",
  "description": "This is an example for a project.",
  "project_id": "PRJ-EXMPL-1234",
  "project_phase": "Production phase",
  "project_owner": "John Smith",
  "project_manager": "Jack Smith",
  "project_type": "Example",
  "project_location": "Copenhagen, Denmark",
  "project_office": "Rambøll Head Office",
  "project_division": "Transport",
  "budget_price_index": "",
  "project_finish": "",
  "workshop_leader": "",
  "workshop_date": "",
  "workshop_participants": "",
  "status": 10,
  "created_at": "2018-01-01 12:00:00.00000",
  "created_by": 1,
  "updated_by": 1,
  "sys_period": {
    "lower": "2018-01-01 12:00:00.00000",
    "upper": null
  }
}
List projects
/api/v1/projects
Gets a list of projects that the user has access to.
Single project
/api/v1/projects/{project_id}
Given a specific id, gets information for the specific project.
Project Group
All core information about a project group. A project group can either represent a single project, or a folder containing other project groups.
Structure
A Project Group is made up of the following parts:
| Name | Type | Read-Only | Required | Comment |
|---|---|---|---|---|
| id | integer | yes | The id of the project group | |
| name | string | yes | The name of the project group | |
| ordering | integer | yes | The ordering of the project group | |
| project | integer | yes | If the project group is not a folder, the id of the project it represents |
|
| parent | integer | yes | If the project group has a parent in the folder structure, the id of the project group that is the parent |
|
| user | integer | yes | The id of the user whose project group this is |
Example:
{
  "id": 1234,
  "name": "Project Folder",
  "ordering": 0,
  "project": null,
  "parent": null,
  "user": 1234
}
List project groups
/api/v1/projectgroups
Gets a list of project groups that the user has access to.
Single project group
/api/v1/projectgroups/{projectgroup_id}
Given a specific id, gets information for the specific project group.
User
All core information about a user
Structure
A User is made up of the following parts:
| Name | Type | Read-Only | Required | Comment |
|---|---|---|---|---|
| id | integer | yes | The id of the user | |
| username | string | yes | The username for the user | |
| string | yes | The email of the user | ||
| first_name | string | yes | The first name of the user | |
| last_name | string | yes | Middle and surname of the user | |
| full_name | string | yes | The user's full name |
Example:
{
  "id": 1234,
  "username": "bob@example.com",
  "email": "bob@example.com",
  "first_name": "Bob",
  "last_name": "M. Smith",
  "full_name": "Bob M. Smith"
}
Get my own user
/api/v1/me
Gets your own user. The one that is determined by the provided authentication.
List users
/api/v1/projects/{project_id}/users
Gets users in a project.
UDF Type
User defined field types are the custom fields which a user can define for a particular project.
Structure
A UDF Type is made up of the following parts:
| Name | Type | Read-Only | Required | Comment |
|---|---|---|---|---|
| id | integer | yes | The id of the udf type | |
| name | string | no | yes | The name of the user defined field |
| type_id | integer | no | yes | The type id of the udf: * TEXT = 10 * NUMBER = 20 * TEXT_LIST = 30 * NUMBER_LIST = 40 * DATE = 70 * DATE_LIST = 80 * LINK = 90 |
| object_type_name | string | no | no | If type_id is LINK, specify what is the type of the object. The supported type is "user" |
| options | string | no | no | Mandatory for LIST fields, Optional for the other field types populated with options the user can select from |
| target_type_name | string | no | yes | Name of the target type. Supported values are "risk", "control", "cause", or "effect". |
| project | integer | yes | no | The id of the project udf is attached to |
Example:
 {
  "id": 20,
  "name": "New field",
  "type_id": 30,
  "object_type_name": null,
  "options": "Excellent\nGood\nPoor\nTerrible",
  "target_type_name": "risk",
  "project": 72
}
List UDF types
/api/v1/projects/{project_id}/udf_types
Lists all the user defined field types for a project for all targets i.e risk, control etc.
udf type can be fetched by sending a GET request to the URL, and can be created with a POST request that follows the rules in the structure above.
Single UDF type
/api/v1/projects/{project_id}/udf_types/{udf_type_id}
A specific udf type in a project fetched through udf type id
A udf type is fetched with a GET request to the URL, and it can be modified with a PUT request that follows the rules in the structure above.
Risk
The risk is the resource that stores all the basic information for a risk. These include description, cause, effect, owner, status, etc. Things like evaluations, confidentiality groups, comments, and controls are their own resources, separate from the risk.
The Risk resource currently exists for v1 and v2. v1 includes a lot of nested structures, while v2 is a simple structure with all the Risk's main fields and related data left out. In cases where you don't need the related data, we recommend using v2, since it will load much faster.
Risk v1 Structure
A v1 Risk is made up of the following parts:
| Name | Type | Read-Only | Required | Comment |
|---|---|---|---|---|
| id | integer | yes | The id of the risk | |
| project | integer | yes | The id of the project that the risk belongs to. | |
| risk_number | integer | yes | The unique number for the risk within the project | |
| title | string | no | no | The title of the risk. |
| risk_description | string | no | yes | The main content of the risk. Its description |
| cause_description | string | no | no | A description of the risk cause |
| effect_description | string | no | no | A description of the risk effect |
| notes_description | string | no | no | A text field for containing notes for the risk |
| status | integer | no | yes | The status code for the risk * 10 = New * 20 = Open * 30 = Closed * 40 = Discarded |
| status_display | string | yes | The text label for the status (new, open, etc.) | |
| owner | integer | no | no | The id of the owner of the risk. May be Null |
| owner_full_name | string | yes | The full name of the owner (a shortcut) | |
| confidential | boolean | yes | Denotes whether the risk is confidential or not | |
| tags | Tags | yes | A list of all the tags applied to the risk | |
| evaluations | Evaluation list | yes | A list of all the evaluations of the risk | |
| udf_values | UDFValue list | yes | A list of all the UDF values attached to the risk. The full UDF type is inlined on each entry, so callers do not need to fetch UDF types separately. | |
| worst_risk | MatrixCell | yes | The cell signifying the worst evaluation. This cell is used to determine the "risk level" by examining either the value or the color field, depending on the use case. |
|
| worst_risk_eval | integer | yes | The evaluation object ID that has the worst "risk level" between all evaluations of this risk. |
|
| created_at | datetime | yes | The date and time that the risk was created | |
| created_by | integer | yes | The id of the user that created the risk | |
| updated_by | integer | yes | The id of the user that last updated the risk | |
| sys_period | datetime range | yes | The time range in which this revision of the risk is valid. An open-ended range marks that this is the current revision |
Example:
{
  "id": 28900,
  "project": 42,
  "risk_number": 6,
  "title": "Man hit by falling object",
  "risk_description": "Man is hit by a falling object",
  "cause_description": "A wire snapped",
  "effect_description": "Worker injured",
  "notes_description": "Maybe Bob and Alice can look into this issue",
  "status": 20,
  "status_display": "Open",
  "owner": null,
  "owner_fullname": "",
  "confidential": false,
  "tags": [
    {
      "id": 18400,
      "project": 42,
      "name": "Construction",
      "category_name": "Phase",
      "ordering": 1,
      "created_at": "2017-01-02 12:45:39.542376",
      "created_by": 59,
      "updated_by": 59,
      "sys_period": {
        "lower": "2017-01-02 12:45:39.542376",
        "upper": null
      }
    }
  ],
  "evaluations": [
    {
      "id": 42000,
      "risk": 28900,
      "evaluation_type": 20,
      "evaluation_type_display": "present",
      "freq_low": 0.05,
      "freq_mid": 0.1,
      "freq_high": 0.2,
      "cons_low": 500.0,
      "cons_mid": 1000.0,
      "cons_high": 2000.0,
      "cell": {
        ...
      },
      "matrix": {
        ...
      },
      "value": 100.0,
      "created_at": "2017-01-02 12:45:39.542376",
      "created_by": 59,
      "updated_by": 59,
      "sys_period": {
        "lower": "2017-01-02 12:45:39.542376",
        "upper": null
      }
    }
  ],
  "worst_risk": {
    ...
  },
  "udf_values": [
    {
      "id": 1234,
      "field_type": {
        "id": 20,
        "name": "New field",
        "type_id": 30,
        "object_type_name": null,
        "options": "Excellent\nGood\nPoor\nTerrible",
        "target_type_name": "risk",
        "project": 42
      },
      "value": "Good",
      "target": {
        "type": "risk",
        "id": 28900
      }
    }
  ],
  "created_at": "2017-01-02 12:45:39.542376",
  "created_by": 59,
  "updated_by": 59,
  "sys_period": {
    "lower": "2017-01-02 12:45:39.542376",
    "upper": null
  }
}
Risk v2 Structure
A v2 Risk is made up of the following parts:
| Name | Type | Read-Only | Required | Comment |
|---|---|---|---|---|
| id | integer | yes | The id of the risk | |
| project | integer | yes | The id of the project that the risk belongs to. | |
| risk_number | integer | yes | The unique number for the risk within the project | |
| title | string | no | no | The title of the risk. |
| risk_description | string | no | yes | The main content of the risk. Its description |
| cause_description | string | no | no | A description of the risk cause |
| effect_description | string | no | no | A description of the risk effect |
| notes_description | string | no | no | A text field for containing notes for the risk |
| status | integer | no | yes | The status code for the risk * 10 = New * 20 = Open * 30 = Closed * 40 = Discarded |
| status_display | string | yes | The text label for the status (new, open, etc.) | |
| owner | integer | no | no | The id of the owner of the risk. May be Null |
| confidential | boolean | yes | Denotes whether the risk is confidential or not | |
| worst_risk | integer | yes | The cell signifying the worst evaluation. This cell is used to determine the "risk level" by examining either the value or the color field, depending on the use case. |
|
| created_at | datetime | yes | The date and time that the risk was created | |
| created_by | integer | yes | The id of the user that created the risk | |
| updated_by | integer | yes | The id of the user that last updated the risk | |
| sys_period | datetime range | yes | The time range in which this revision of the risk is valid. An open-ended range marks that this is the current revision |
Example:
{
  "id": 28900,
  "project": 42,
  "risk_number": 6,
  "title": "Man hit by falling object",
  "risk_description": "Man is hit by a falling object",
  "cause_description": "A wire snapped",
  "effect_description": "Worker injured",
  "notes_description": "Maybe Bob and Alice can look into this issue",
  "status": 20,
  "status_display": "Open",
  "owner": 12,
  "confidential": false,
  "worst_risk": 337,
  "created_at": "2017-01-02 12:45:39.542376",
  "created_by": 59,
  "updated_by": 59,
  "sys_period": {
    "lower": "2017-01-02 12:45:39.542376",
    "upper": null
  }
}
List risks
/api/v1/projects/{project_id}/risks
/api/v2/projects/{project_id}/risks
Since risks are one of the major resources of the application, their path is close to the root. Risks are always accessed under their relevant project.
Risks can be fetched by sending a GET request to the URL, and can be created with a POST request that follows the rules in the structure above.
Available filters
The list of risks can be filtered using the following query parameters:
| Parameter | Type | Description |
|---|---|---|
| status | integer | Filter by status code. Codes are: * 10: New * 20: Open * 30: Closed * 40: Discarded |
| owner | integer | Filter by the id of the risk owner |
| confidential | boolean | Filter by confidentiality (true or false) |
| q | string | Free text search on risk number, title, description, notes, comments, causes/effects, and owner name |
| reviewed_after_date | date (YYYY-MM-DD) | Filter risks that have been reviewed on or after this date |
| reviewed_before_date | date (YYYY-MM-DD) | Filter risks that have been reviewed before this date |
Example: GET /api/v2/projects/1/risks?status=10 returns all risks with status "New".
Single risk
/api/v1/projects/{project_id}/risks/{risk_id}
/api/v2/projects/{project_id}/risks/{risk_id}
A specific risk in a project. Please notice that the id of the risk is
referenced, not the risk_number.
A risk is fetched with a GET request to the URL, and it can be modified with a PUT request that follows the rules in the structure above.
Attached Controls
/api/v1/projects/{project_id}/risks/{risk_id}/controls
Retrieves a list of all the controls that are currently attached to the risk. The controls follow the structure outlined in Control.
This endpoint is read-only.
Attachable Controls
/api/v1/projects/{project_id}/risks/{risk_id}/attachable_controls
Retrieves a list of all the controls that are available to be attached to the risk, that is, all controls in the project, that are currently not attached to the risk. The controls follow the structure outlined in Control.
This endpoint is read-only.
Attaching Controls
/api/v1/projects/{project_id}/risks/{risk_id}/riskcontrols
In order to attach a control, simply issue a PUT request to the resource URL above containing the following structure:
{
  "id": 4
}
Where the id is the id of the control you wish to attach.
Related Tags
/api/v1/projects/{project_id}/risks/{risk_id}/tags
Retrieves a list of all the tags that are related to the risk. The tags follow the structure outlined in Tag. Users can assign tags to the risk with a PUT request to the URL above, specifying a list of tag ids to be attached to the risk. Tags that were previously attached to the risk but are not in the PUT request, will be detached from the risk.
Example of tags to assign to the risk:
{
  "tags": [
    1,
    2,
    3
  ]
}
RiskTags
The structure representing a connection from a tag to a risk.
Structure
A RiskTag is made up of the following parts:
| Name | Type | Read-Only | Required | Comment |
|---|---|---|---|---|
| id | integer | yes | The id of the RiskTag | |
| risk | integer | yes | The primary key of the related risk | |
| tag | integer | yes | The primary key of the related tag | |
| created_at | datetime | yes | The date and time that the RiskTag was created | |
| created_by | integer | yes | The id of the user that created the RiskTag | |
| updated_by | integer | yes | The id of the user that last updated the RiskTag | |
| sys_period | datetime range | yes | The time range in which this revision of the RiskTag is valid. An open-ended range marks that this is the current revision |
Example:
{
  "id": 123,
  "risk": 34,
  "tag": 23,
  "created_at": "2017-01-02 12:45:39.542376",
  "created_by": 1,
  "updated_by": 1,
  "sys_period": {
    "lower": "2017-01-02 12:45:39.542376",
    "upper": null
  }
}
List RiskTags
/api/v1/projects/{project_id}/risktags
All RiskTags in a specific project.
RiskTags can be fetched by sending a GET request to the URL.
Single RiskTag
/api/v1/projects/{project_id}/risktags/{risktag_id}
A specific RiskTag in a project.
A RiskTag is fetched with a GET request to the URL.
Causalities
/api/v1/projects/causalities
A "causality" is an object relating to the cause or effect of a risk. The reason for keeping causes and effects inside of the same resource is a technical one at this point. They are very similarly structured and share a close relationship, so it made sense to keep them close in their abstraction as well.
A single instance of a causality represents either a cause or an effect. Whether it is one or the other is represented by the is_cause flag on the resource.
Structure
A Causality is made up of the following parts:
| Name | Type | Read-Only | Required | Comment |
|---|---|---|---|---|
| id | integer | yes | The primary key of the causality | |
| project | integer | yes | The primary key of the related project | |
| number | integer | yes | Unique number for the causality inside of its project | |
| text | string | no | yes | Text that makes up the content of the causality |
| status | integer | no | The status code for the causality * 10 = Possible * 20 = Done * 30 = Discarded |
|
| status_display | string | yes | The text label for the status | |
| is_cause | boolean | no | yes | Whether it is a cause of effect |
| udf_values | UDFValue list | yes | A list of all the UDF values attached to the causality. The full UDF type is inlined on each entry, so callers do not need to fetch UDF types separately. | |
| created_at | datetime | yes | The date and time that the causality was created | |
| created_by | integer | yes | The id of the user that created the causality | |
| updated_by | integer | yes | The id of the user that last updated the causality | |
| sys_period | datetime range | yes | The time range in which this revision of the causality is valid. An open-ended range marks that this is the current revision. |
Example:
{
  "id": 1,
  "project": 2,
  "number": 3,
  "text": "Wire snaps",
  "is_cause": true,
  "created_at": "2017-01-02 12:45:39.542376",
  "created_by": 3,
  "updated_by": 3,
  "sys_period": {
    "lower": "2017-01-02 12:45:39.542376",
    "upper": null
  }
}
List causalities
/api/v1/projects/{project_id}/causalities
A GET request to this URL will return a list of all the causalities in
the project specified by risk_id.
/api/v1/projects/{project_id}/risks/{risk_id}/causalities
A GET request to this URL will return a list of all the causalities on
the risk specified by risk_id.
Single causality
/api/v1/projects/{project_id}/causalities/{causality_id}
Get a single causality specified by causality_id.
/api/v1/projects/{project_id}/risks/{risk_id}/causalities/{causality_id}
Get a single causality specified by causality_id, which is attached to
the risk specified by risk_id.
Causalities can be updated from these URLs.
RiskCausalities
The structure representing a connection from a causality to a risk.
Structure
A RiskCausality is made up of the following parts:
| Name | Type | Read-Only | Required | Comment |
|---|---|---|---|---|
| id | integer | yes | The id of the RiskCausality | |
| risk | integer | yes | The primary key of the related risk | |
| causality | integer | yes | The primary key of the related causality | |
| created_at | datetime | yes | The date and time that the RiskCausality was created | |
| created_by | integer | yes | The id of the user that created the RiskCausality | |
| updated_by | integer | yes | The id of the user that last updated the RiskCausality |
|
| sys_period | datetime range | yes | The time range in which this revision of the RiskCausality is valid. An open-ended range marks that this is the current revision |
Example:
{
  "id": 123,
  "risk": 34,
  "causality": 23,
  "created_at": "2017-01-02 12:45:39.542376",
  "created_by": 1,
  "updated_by": 1,
  "sys_period": {
    "lower": "2017-01-02 12:45:39.542376",
    "upper": null
  }
}
List RiskCausality
/api/v1/projects/{project_id}/riskcausalities
All RiskCausalities in a specific project.
RiskCausalities can be fetched by sending a GET request to the URL.
Risk comments
/api/v1/projects/{project_id}/risks/{risk_id}/comments
All the comments on a given risk listed in descending chronological order.
Structure
A Comment is made up of the following parts:
| Name | Type | Read-Only | Required | Comment |
|---|---|---|---|---|
| id | integer | yes | The primary key of the comment | |
| project | integer | yes | The primary key of the related project | |
| owner | integer | yes | The primary key of the author | |
| owner_short_name | string | yes | E.g. John S. | |
| owner_full_name | string | yes | E.g. John Smith | |
| owner_email | string | yes | Authors email | |
| date | string | yes | Timestamp for the creation of the comment | |
| comment | string | no | yes | The actual content of the comment |
| risk | integer | yes | The primary key of the related risk | |
| created_at | datetime | yes | The date and time that the comment was created | |
| created_by | integer | yes | The id of the user that created the comment | |
| updated_by | integer | yes | The id of the user that last updated the comment | |
| sys_period | datetime range | yes | The time range in which this revision of the comment is valid. An open-ended range marks that this is the current revision |
Example:
{
  "id": 1,
  "project": 2,
  "owner": 3,
  "owner_short_name": "John S.",
  "owner_full_name": "John Smith",
  "owner_email": "john@smith.com",
  "date": "2017-01-02 12:45:39.542376",
  "comment": "I have ideas for this risk",
  "created_at": "2017-01-02 12:45:39.542376",
  "created_by": 3,
  "updated_by": 3,
  "sys_period": {
    "lower": "2017-01-02 12:45:39.542376",
    "upper": null
  },
  "risk": 4
}
List risk comments
/api/v1/projects/{project_id}/risks/{risk_id}/comments
A GET request to this URL will return a list of all the comments on the
risk specified by risk_id. It is also possible to POST a new comment
to the URL above, following the structure outlined in Risk comments.
Single risk comment
/api/v1/projects/{project_id}/risks/{risk_id}/comments/{comment_id}
Get a single comment specified by risk_id. Comments can be updated and
deleted from this URL.
Risk references
/api/v1/projects/{project_id}/risks/{risk_id}/references
All the references to or from on a given risk listed in descending chronological order.
Structure
See outlined structure in Reference.
List risk references
/api/v1/projects/{project_id}/risks/{risk_id}/references
List all references on the risk specified by risk_id. It is
possible to create a new Reference from this control with a POST request
to the URL above. The data in the request should follow the structure
outlined in Reference.
Single risk reference
/api/v1/projects/{project_id}/risks/{risk_id}/references/{reference_id}
Get a single risk reference specified by risk_id and reference_id.
Single References can be updated and deleted from the URL above.
Control
The control stores information about measures that need to be taken in order to mitigate a risk. A control can be given a deadline and assigned to a user.
Structure
A Control is made up of the following parts:
| Name | Type | Read-Only | Required | Comment |
|---|---|---|---|---|
| id | integer | yes | The id of the Control | |
| project | integer | yes | The id of the project that the control belongs to. | |
| control_number | integer | yes | no | The unique number for the control within the project. |
| description | string | no | yes | The main content of the control |
| status | integer | no | no | The status code for the control * 10 = Possible * 20 = Planned * 30 = Ongoing * 40 = Done * 50 = Discarded |
| status_display | string | yes | The text label for the status | |
| deadline | string | no | no | The date at which the control should have been implemented |
| next_deadline | string | yes | When recurrence is enabled, this will display the next deadline defined by the recurrence |
|
| assigned_to | number | no | yes | The user responsible for implementing the Control |
| assigned_to_full_name | string | yes | The full name of the assigned_to user |
|
| urgency | string | yes | A description of how close the deadline is: * "expired" * "close" * "" - empty |
|
| has_comments | boolean | yes | Whether the control has comments on it | |
| tags | Tags | no | no | A list of all tags applied to the control |
| udf_values | UDFValue list | yes | A list of all the UDF values attached to the control. The full UDF type is inlined on each entry, so callers do not need to fetch UDF types separately. | |
| created_at | datetime | yes | The date and time that the control was created | |
| created_by | integer | yes | The id of the user that created the control | |
| updated_by | integer | yes | The id of the user that last updated the control | |
| sys_period | datetime range | yes | The time range in which this revision of the control is valid. An open-ended range marks that this is the current revision |
Example:
{
  "project": 42,
  "control_number": 6,
  "description": "Stronger wire",
  "status": 20,
  "status_display": "Planned",
  "assigned_to": 8,
  "assigned_to_fullname": "John Smith",
  "deadline": "2017-01-05",
  "urgency": "close",
  "has_comments": false,
  "next_deadline": null,
  "tags": [],
  "udf_values": [
    {
      "id": 4567,
      "field_type": {
        "id": 21,
        "name": "Effort",
        "type_id": 10,
        "object_type_name": null,
        "options": "",
        "target_type_name": "control",
        "project": 42
      },
      "value": "Large",
      "target": {
        "type": "control",
        "id": 28950
      }
    }
  ],
  "created_at": "2017-01-02 12:45:39.542376",
  "created_by": 59,
  "updated_by": 59,
  "sys_period": {
    "lower": "2017-01-02 12:45:39.542376",
    "upper": null
  }
}
List controls
/api/v1/projects/{project_id}/controls
All controls in a specific project.
Controls can be fetched by sending a GET request to the URL, and can be created with a POST request that follows the rules in the structure above.
Available filters
The list of controls can be filtered using the following query parameters:
| Parameter | Type | Description |
|---|---|---|
| status | integer | Filter by status code. Codes are: * 10: Possible * 20: Planned * 30: Ongoing * 40: Done * 50: Discarded |
| owners | integer | Filter by the id of the assigned user |
| q | string | Free text search on control number, description, and assigned user name |
Example: GET /api/v1/projects/1/controls?status=30 returns all controls with status "Ongoing".
Single control
/api/v1/projects/{project_id}/controls/{control_id}
A specific control in a project. Please notice that the id of the
control is referenced, not the control_number.
A control is fetched with a GET request to the URL, and it can be modified with a PUT request that follows the rules in the structure above.
List attached risks
/api/v1/projects/{project_id}/controls/{control_id}/risks
All risks in a specific project attached to a specific control. Risks can be fetched by sending a GET request to the URL.
Related Tags
/api/v1/projects/{project_id}/controls/{control_id}/tags
Retrieves a list of all the tags that are related to the control. The tags follow the structure outlined in CATag. Users can assign tags to the control with a PUT request to the URL above, specifying a list of tag ids to be attached to the control. Tags that were previously attached to the control but are not in the PUT request, will be detached from the control.
Example of tags to assign to the control:
{
  "tags": [
    1,
    2,
    3
  ]
}
Control Recurrence
/api/v1/projects/{project_id}/controls/{control_id}/recurrence
The recurrence definition of the control, if any is set. If the control is not recurring, the response will be 404 - not found.
For the case where the control is in fact recurring, the following structure will be given in the response.
Structure
Recurrence is made up of the following parts:
| Name | Type | Read-Only | Required | Comment |
|---|---|---|---|---|
| id | integer | yes | The id of the recurrence definition | |
| repr | string | yes | A natural language description of the recurrence | |
| control_deadline | string | yes | a shortcut for the date of the control's deadline | |
| next_date | string | yes | The new deadline that will follow the current one | |
| control | integer | yes | The primary key of the related control | |
| scope_type | integer | no | yes | An integer switch determining what the scope of the recurrence is: * 10 = Daily * 20 = Weekly * 30 = Monthly * 40 = Yearly |
| day_interval | integer | no | no | The amount of days between occurrences, if using daily scope. |
| week_interval | integer | no | no | The number of weeks between occurrences, if using weekly scope. |
| week_recur_days | string | no | no | Comma separated list of integers. Each integer represents a weekday on which to recur for weekly scope * 10 = Monday * 20 = Tuesday * 30 = Wednesday * 40 = Thursday * 50 = Friday * 60 = Saturday * 70 = Sunday |
| month_date | integer | no | no | The date (1-31) to recur for monthly scope. |
| month_interval | integer | no | no | The amount of months between occurrences, if using monthly scope. |
| nth_match | integer | no | no | A switch for selecting abstract counting of days in months * 10 = First * 20 = Second * 30 = Third * 40 = Fourth * 50 = Last |
| day_of_week | integer | no | no | A switch for selecting specific target days in combination with nth_match* 10 = Monday * 20 = Tuesday * 30 = Wednesday * 40 = Thursday * 50 = Friday * 60 = Saturday * 70 = Sunday * 80 = Workday * 90 = Weekend day * 100 = Day |
| year_interval | integer | no | no | The amount of years between occurrences, if using yearly scope |
| year_month | integer | no | no | A switch for selecting a month for the yearly scope * 1 = January * 2 = February * 3 = March * 4 = April * 5 = May * 6 = June * 7 = July * 8 = August * 9 = September * 10 = October * 11 = November * 12 = December |
| created_at | datetime | yes | The date and time that the recurrence was created | |
| created_by | integer | yes | The id of the user that created the recurrence | |
| updated_by | integer | yes | The id of the user that last updated the recurrence | |
| sys_period | datetime range | yes | The time range in which this revision of the recurrence is valid. An open-ended range marks that this is the current revision |
Example:
{
  "id": 3,
  "repr": "Every 1st workday of every March of every 3 years",
  "control_deadline": "2017-03-01",
  "next_date": "2020-03-02",
  "control": 42,
  "scope_type": 40,
  "day_interval": null,
  "week_interval": null,
  "week_recur_days": null,
  "month_date": null,
  "month_interval": null,
  "nth_match": 10,
  "day_of_week": 80,
  "year_interval": 3,
  "year_month": 3,
  "created_at": "2017-01-02 12:45:39.542376",
  "created_by": 59,
  "updated_by": 59,
  "sys_period": {
    "lower": "2017-01-02 12:45:39.542376",
    "upper": null
  }
}
ControlTags
The structure representing a connection from a tag to a control.
Structure
A ControlTag is made up of the following parts:
| Name | Type | Read-Only | Required | Comment |
|---|---|---|---|---|
| id | integer | yes | The id of the ControlTag | |
| control | integer | yes | The primary key of the related control | |
| tag | integer | yes | The primary key of the related tag | |
| created_at | datetime | yes | The date and time that the ControlTag was created | |
| created_by | integer | yes | The id of the user that created the ControlTag | |
| updated_by | integer | yes | The id of the user that last updated the ControlTag | |
| sys_period | datetime range | yes | The time range in which this revision of the ControlTag is valid. An open-ended range marks that this is the current revision |
Example:
{
  "id": 123,
  "control": 34,
  "tag": 23,
  "created_at": "2017-01-02 12:45:39.542376",
  "created_by": 1,
  "updated_by": 1,
  "sys_period": {
    "lower": "2017-01-02 12:45:39.542376",
    "upper": null
  }
}
List ControlTags
/api/v1/projects/{project_id}/controltags
All ControlTags in a specific project.
ControlTags can be fetched by sending a GET request to the URL.
Single ControlTag
/api/v1/projects/{project_id}/controltags/{controltag_id}
A specific ControlTag in a project.
A ControlTag is fetched with a GET request to the URL.
Control comments
/api/v1/projects/{project_id}/controls/{control_id}/comments
All the comments on a given control listed in descending chronological order.
Structure
A Comment is made up of the following parts:
| Name | Type | Read-Only | Required | Comment |
|---|---|---|---|---|
| id | integer | yes | The primary key of the comment | |
| project | integer | yes | The primary key of the related project | |
| owner | integer | yes | The primary key of the author | |
| owner_short_name | string | yes | E.g. John S. | |
| owner_full_name | string | yes | E.g. John Smith | |
| owner_email | string | yes | Authors email | |
| date | string | yes | Timestamp for the creation of the comment | |
| comment | string | no | yes | The actual content of the comment |
| control | integer | yes | The primary key of the related control | |
| created_at | datetime | yes | The date and time that the comment was created | |
| created_by | integer | yes | The id of the user that created the comment | |
| updated_by | integer | yes | The id of the user that last updated the comment | |
| sys_period | datetime range | yes | The time range in which this revision of the comment is valid. An open-ended range marks that this is the current revision |
Example:
{
  "id": 1,
  "project": 2,
  "owner": 3,
  "owner_short_name": "John S.",
  "owner_full_name": "John Smith",
  "owner_email": "john@smith.com",
  "date": "2017-01-02 12:45:39.542376",
  "comment": "I have ideas for this control",
  "created_at": "2017-01-02 12:45:39.542376",
  "created_by": 3,
  "updated_by": 3,
  "sys_period": {
    "lower": "2017-01-02 12:45:39.542376",
    "upper": null
  },
  "control": 4
}
List control comments
/api/v1/projects/{project_id}/controls/{control_id}/comments
A GET request to this URL will return a list of all the comments on the
control specified by control_id. It is also possible to POST a new
comment to the URL above, following the structure outlined in the
Control.
Single control comment
/api/v1/projects/{project_id}/controls/{control_id}/comments/{comment_id}
Get a single comment specified by control_id. Comments can be updated
and deleted from this URL.
Control references
/api/v1/projects/{project_id}/control/{control_id}/references
All the references to or from on a given control listed in descending chronological order.
Structure
See outlined structure in Reference.
List control references
/api/v1/projects/{project_id}/controls/{control_id}/references
List all references on the control specified by control_id. It
is possible to create a new Reference from this control with a POST
request to the URL above. The data in the request should follow the
structure outlined in Reference.
Single control reference
/api/v1/projects/{project_id}/controls/{control_id}/references/{reference_id}
Get a single control reference specified by control_id and
reference_id. Single References can be updated and deleted from the
URL above.
RiskControls
The structure representing a connection from a control to a risk.
Structure
A RiskControl is made up of the following parts:
| Name | Type | Read-Only | Required | Comment |
|---|---|---|---|---|
| id | integer | yes | The id of the RiskControl | |
| project | integer | yes | The id of the project that the RiskControl belongs to. | |
| risk | integer | yes | The primary key of the related risk | |
| control | integer | yes | The primary key of the related RiskControl | |
| created_at | datetime | yes | The date and time that the RiskControl was created | |
| created_by | integer | yes | The id of the user that created the RiskControl | |
| updated_by | integer | yes | The id of the user that last updated the RiskControl | |
| sys_period | datetime range | yes | The time range in which this revision of the RiskControl is valid. An open-ended range marks that this is the current revision |
Example:
{
  "id": 123,
  "project": 12,
  "risk": 34,
  "control": 23,
  "created_at": "2017-01-02 12:45:39.542376",
  "created_by": 1,
  "updated_by": 1,
  "sys_period": {
    "lower": "2017-01-02 12:45:39.542376",
    "upper": null
  }
}
List RiskControls
/api/v1/projects/{project_id}/riskcontrols
All RiskControls in a specific project.
RiskControls can be fetched by sending a GET request to the URL.
Single RiskControl
/api/v1/projects/{project_id}/riskcontrols/{riskcontrol_id}
A specific RiskControl in a project.
A RiskControl is fetched with a GET request to the URL.
ControlCosts
The cost of controls referred to a RiskTarget.
Structure
A ControlCost is made up of the following parts:
| Name | Type | Read-Only | Required | Comment |
|---|---|---|---|---|
| id | integer | yes | The id of the ControlCost | |
| project | integer | yes | The id of the project that the ControlCost belongs to. | |
| risk_target | integer | no | The primary key of the related risk target | |
| risk_target_name | string | yes | The name of the related risk target | |
| unit | string | yes | The unit of the related risk target | |
| control | integer | no | The primary key of the related control | |
| value | integer | no | The value of this control cost, expressed in the unit of the risk target |
|
| created_at | datetime | yes | The date and time that the control cost was created | |
| created_by | integer | yes | The id of the user that created the control cost | |
| updated_by | integer | yes | The id of the user that last updated the control cost | |
| sys_period | datetime range | yes | The time range in which this revision of the control cost is valid. An open-ended range marks that this is the current revision |
Example:
{
  "id": 123,
  "project": 12,
  "risk_target": 34,
  "control": 23,
  "type": 10,
  "value": 1000,
  "created_at": "2017-01-02 12:45:39.542376",
  "created_by": 1,
  "updated_by": 1,
  "sys_period": {
    "lower": "2017-01-02 12:45:39.542376",
    "upper": null
  }
}
List control costs
/api/v1/projects/{project_id}/controlcosts
/api/v1/projects/{project_id}/controls/{control_id}/controlcosts
All control costs in a specific project and/or for a specific control.
Control costs can be fetched by sending a GET request to the URLs. New control costs can be created with a POST request to the URLs.
Single control cost
/api/v1/projects/{project_id}/controlcosts/{controlcost_id}
/api/v1/projects/{project_id}/controls/{control_id}/controlcosts/{controlcost_id}
A specific control cost in a project.
A control cost is fetched with a GET request to the URL. A control cost can be updated with a PUT/PATCH request to the URL. A control cost can be deleted with a DELETE request to the URL.
RiskReviews
The information regarding who and when reviewed a certain Risk.
Structure
A RiskReview is made up of the following parts:
| Name | Type | Read-Only | Required | Comment |
|---|---|---|---|---|
| id | integer | yes | The id of the RiskReview | |
| project | integer | yes | The id of the project that the RiskReview belongs to |
|
| risk | integer | yes | The primary key of the related risk | |
| reviewed_by | string | yes | The primary key of the User who performed the review | |
| reviewed_by_full_name | string | yes | The full name of the User who performed the review | |
| modified | date | yes | The date when the last review was performed |
Example:
{
  "id": 123,
  "project": 111,
  "risk": 222,
  "reviewed_by": 333,
  "reviewed_by_full_name": "John Smith",
  "modified": "2017-01-02"
}
Single RiskReview
/api/v1/projects/{project_id}/risks/{risk_id}/riskreview
The review of the given Risk.
A review is fetched with a GET request to the URL.
Action
The action is a way to break up a control into multiple tasks. The point is that a control may be too big for one person to be responsible for, and thus it is useful to be able to break it up and assign individual tasks to different people.
Structure
An Action is made up of the following parts:
| Name | Type | Read-Only | Required | Comment |
|---|---|---|---|---|
| id | integer | yes | The id of the Action | |
| project | integer | yes | The id of the project that the action belongs to. |
|
| control | integer | yes | The id of the control that owns the action | |
| action_number | integer | yes | no | The unique number for the action within the project. |
| description | string | no | yes | The main content of the action |
| assigned_to | number | no | no | The user responsible for performing the action |
| deadline | string | no | no | The date at which the action should have been performed |
| status | integer | no | yes | The status code for the action * 10 = Possible * 20 = Planned * 30 = Ongoing * 40 = Done * 50 = Discarded |
| status_display | string | yes | The text label for the status | |
| assigned_to_full_name | string | yes | The full name of the "assigned_to" user | |
| tags | Tag list | no | no | A list of all tags applied to the action |
| created_at | datetime | yes | The date and time that the action was created | |
| created_by | integer | yes | The id of the user that created the action | |
| updated_by | integer | yes | The id of the user that last updated the action | |
| sys_period | datetime range | yes | The time range in which this revision of the action is valid. An open-ended range marks that this is the current revision. |
Example:
{
  "project": 42,
  "action_number": 6,
  "control": 79,
  "description": "Stronger wire",
  "status": 20,
  "status_display": "Planned",
  "assigned_to": 8,
  "assigned_to_fullname": "John Smith",
  "deadline": "2017-01-05",
  "has_comments": false,
  "next_deadline": null,
  "tags": [],
  "created_at": "2017-01-02 12:45:39.542376",
  "created_by": 59,
  "updated_by": 59,
  "sys_period": {
    "lower": "2017-01-02 12:45:39.542376",
    "upper": null
  }
}
List actions
/api/v1/projects/{project_id}/actions
All actions in a specific project.
Actions can be fetched by sending a GET request to the URL, and can be created with a POST request that follows the rules in the structure above.
Available filters
The list of actions can be filtered using the following query parameters:
| Parameter | Type | Description |
|---|---|---|
| status | integer | Filter by status code. Codes are: * 10: Possible * 20: Planned * 30: Ongoing * 40: Done * 50: Discarded |
| owners | integer | Filter by the id of the assigned user |
| q | string | Free text search on action number, description, and assigned user name |
Example: GET /api/v1/projects/1/actions?status=40 returns all actions with status "Done".
/api/v1/projects/{project_id}/controls/{control_id}/actions
All actions owned by a specific control.
Single action
/api/v1/projects/{project_id}/actions/{action_id}
A specific action in a project. Please notice that the id of the
action is referenced, not the action_number.
An action is fetched with a GET request to the URL, and it can be modified with a PUT request that follows the rules in the structure above.
Related Tags
/api/v1/projects/{project_id}/actions/{action_id}/tags
Retrieves a list of all the CAtags that are related to the action. The tags follow the structure outlined in CATag. Users can assign tags to the risk with a PUT request to the URL above, specifying a list of tag ids to be attached to the action. Tags that were previously attached to the action but are not in the PUT request, will be detached from the action.
Example of tags to assign to the action:
{
  "tags": [
    1,
    2,
    3
  ]
}
ActionTags
The structure representing a connection from a tag to an action.
Structure
An ActionTag is made up of the following parts:
| Name | Type | Read-Only | Required | Comment |
|---|---|---|---|---|
| id | integer | yes | The id of the ActionTag | |
| action | integer | yes | The primary key of the related action | |
| tag | integer | yes | The primary key of the related tag | |
| created_at | datetime | yes | The date and time that the ActionTag was created | |
| created_by | integer | yes | The id of the user that created the ActionTag | |
| updated_by | integer | yes | The id of the user that last updated the ActionTag | |
| sys_period | datetime range | yes | The time range in which this revision of the ActionTag is valid. An open-ended range marks that this is the current revision. |
Example:
{
  "id": 123,
  "action": 34,
  "tag": 23,
  "created_at": "2017-01-02 12:45:39.542376",
  "created_by": 1,
  "updated_by": 1,
  "sys_period": {
    "lower": "2017-01-02 12:45:39.542376",
    "upper": null
  }
}
List ActionTags
/api/v1/projects/{project_id}/actiontags
All ActionTags in a specific project.
ActionTags can be fetched by sending a GET request to the URL.
Single ActionTag
/api/v1/projects/{project_id}/actiontags/{actiontag_id}
A specific ActionTag in a project.
A ActionTag is fetched with a GET request to the URL.
Action comments
/api/v1/projects/{project_id}/actions/{action_id}/comments
All the comments on a given action listed in descending chronological order.
Structure
A Comment is made up of the following parts:
| Name | Type | Read-Only | Required | Comment |
|---|---|---|---|---|
| id | integer | yes | The primary key of the comment | |
| project | integer | yes | The primary key of the related project | |
| owner | integer | yes | The primary key of the author | |
| owner_short_name | string | yes | E.g. John S. | |
| owner_full_name | string | yes | E.g. John Smith | |
| owner_email | string | yes | Authors email | |
| date | string | yes | Timestamp for the creation of the comment | |
| comment | string | no | yes | The actual content of the comment |
| action | integer | yes | The primary key of the related action | |
| created_at | datetime | yes | The date and time that the comment was created | |
| created_by | integer | yes | The id of the user that created the comment | |
| updated_by | integer | yes | The id of the user that last updated the comment | |
| sys_period | datetime range | yes | The time range in which this revision of the comment is valid. An open-ended range marks that this is the current revision |
Example:
{
  "id": 1,
  "project": 2,
  "owner": 3,
  "owner_short_name": "John S.",
  "owner_full_name": "John Smith",
  "owner_email": "john@smith.com",
  "date": "2017-01-02 12:45:39.542376",
  "comment": "I have ideas for this control",
  "created_at": "2017-01-02 12:45:39.542376",
  "created_by": 3,
  "updated_by": 3,
  "sys_period": {
    "lower": "2017-01-02 12:45:39.542376",
    "upper": null
  },
  "action": 4
}
List action comments
/api/v1/projects/{project_id}/actions/{action_id}/comments
A GET request to this URL will return a list of all the comments on the
action specified by action_id. It is also possible to POST a new
comment to the URL above, following the structure outlined in the Action comments.
Single action comment
/api/v1/projects/{project_id}/actions/{action_id}/comments/{comment_id}
Get a single comment specified by action_id. Comments can be updated
and deleted from this URL.
Action references
/api/v1/projects/{project_id}/action/{action_id}/references
All the references to or from on a given action listed in descending chronological order.
Structure
See outlined structure in Reference.
List action references
/api/v1/projects/{project_id}/actions/{action_id}/references
List all references on the action specified by action_id. It is
possible to create a new Reference from this action with a POST request
to the URL above. The data in the request should follow the structure
outlined in Reference.
Single action reference
/api/v1/projects/{project_id}/actions/{action_id}/references/{reference_id}
Get a single action reference specified by action_id and
reference_id. Single References can be updated and deleted from the
URL above.
UDF Value
A custom value or a value chosen from options for a udf type for
a project. Every UDF value belongs to a single target object — currently
a Risk, Control, Cause, or Effect — and that owner is referenced through
the target field on the value.
UDF values are also included inline on the Risk, Control, and Causality
resources (under their udf_values field), so when fetching a single
object you do not need to issue an extra request. The dedicated UDF
value endpoints below are useful when you want to fetch values for many
objects at once (typically the project-wide endpoint), or when you need
to create, update, or delete values one-by-one.
Structure
A UDF Value is made up of the following parts:
| Name | Type | Read-Only | Required | Comment |
|---|---|---|---|---|
| id | integer | yes | The id of the UDF value | |
| field_type | object | yes | yes | The UDF type the value belongs to. The full UDF type is inlined (id, name, type_id, options, target_type_name, etc.) so callers don't need to fetch the UDF types separately. On POST, send the type id only. |
| value | string | no | yes | The value of the UDF type. For text/number/date types this is a custom value. For list/option types it must be one of the options. |
| target | object | yes | A reference to the owner of the UDF value. Contains type (the model name: risk, control, cause, or effect) and id (the owner's primary key). |
Example (GET):
{
  "id": 1234,
  "field_type": {
    "id": 20,
    "name": "New field",
    "type_id": 30,
    "object_type_name": null,
    "options": "Excellent\nGood\nPoor\nTerrible",
    "target_type_name": "risk",
    "project": 72
  },
  "value": "Good",
  "target": {
    "type": "risk",
    "id": 28900
  }
}
List all UDF values in a project
/api/v1/projects/{project_id}/udf_values
Lists every UDF value in the project, across all targets (risks,
controls, causes, and effects). Each entry includes the target field
so callers can associate the values with their owners without issuing
additional requests. This is the recommended endpoint when you need
UDF values for many objects at once (e.g. when rendering a list of
risks together with their custom field values).
This endpoint is read-only; use the per-target endpoints below to create or modify UDF values.
List UDF values for a single target
/api/v1/projects/{project_id}/risks/{risk_id}/udf_values
or
/api/v1/projects/{project_id}/controls/{control_id}/udf_values
or
/api/v1/projects/{project_id}/causality/{causality_id}/udf_values
Lists all the user defined field values for a single target (risk,
control, cause, or effect). Causes and effects are both reached via the
causality endpoint using the causality id.
UDF values can be fetched by sending a GET request to the URL, and can be created with a POST request that follows the rules below.
The POST request body consists of the following parts:
| Name | Type | Read-Only | Required | Comment |
|---|---|---|---|---|
| field_type | integer | no | yes | The id of the UDF type the value belongs to. Must be a UDF type whose target_type_name matches the target in the URL. |
| value | string | no | yes | The value of the UDF type. For text/number/date types this is a custom value. For list/option types it must be one of the options. |
Example (POST):
{
  "field_type": 20,
  "value": "Good"
}
Evaluation
The evaluation describes a single evaluation of a risk on a risk matrix. The evaluation is hence a reference to the Risk that is evaluated, the Matrix on which it is evaluated and the MatrixCell in which the evaluation is residing. Additionally, the evaluation may contain triple point estimations for frequency and consequence. The value of the evaluation is also available directly.
Structure
An Evaluation is made up of the following parts:
| Name | Type | Read-Only | Required | Comment |
|---|---|---|---|---|
| id | integer | yes | The id of the Evaluation | |
| risk | integer | yes | The id of the related risk | |
| evaluation_type | integer | no | no (defaults to 20) | The type of evaluation: - 10: Gross - 20: Present - 30: Nett |
| evaluation_type_display | string | yes | The name of the evaluation_type: gross/present/nett |
|
| freq_low | float | no | no | The "low" part of a frequency triple |
| freq_mid | float | no | no | The "mid" part of a frequency triple |
| freq_high | float | no | no | The "high" part of a frequency triple |
| cons_low | float | no | no | The "low" part of a consequence triple |
| cons_mid | float | no | no | The "mid" part of a consequence triple |
| cons_high | float | no | no | The "high" part of a consequence triple |
| cell | MatrixCell | no | no | The cell in which the evaluation lies |
| matrix | Matrix | yes | The matrix that is evaluated on | |
| value | float | yes | The calculated value of the evaluation. If matrix.explicit_evaluation, this value is calculated by cmean * fmean. If not, it is calculated by frequency.mid * consequence.mid |
|
| created_at | datetime | yes | The date and time that the evaluation was created | |
| created_by | integer | yes | The id of the user that created the evaluation | |
| updated_by | integer | yes | The id of the user that last updated the evaluation | |
| sys_period | datetime range | yes | The time range in which this revision of the evaluation |
is valid. An open-ended range marks that this is
the current revision.|
List evaluations
/api/v1/projects/{project_id}/evaluations
All evaluations in a specific project.
Evaluations can be fetched by sending a GET request to the URL, and can be created with a POST request that follows the rules in the structure above.
Available filters
The list of evaluations can be filtered using the following query parameters:
| Parameter | Type | Description |
|---|---|---|
| evaluation_type | integer | Filter by evaluation type. Codes are: * 10: Gross * 20: Present * 30: Nett |
Example: GET /api/v1/projects/1/evaluations?evaluation_type=20 returns all present evaluations.
Single evaluation
/api/v1/projects/{project_id}/evaluations/{evaluation_id}
A specific evaluation in a specific project.
An evaluation is fetched with a GET request to the URL, and it can be modified with a PUT request that follows the rules in the structure above. A DELETE request to the URL will delete the evaluation.
Matrix
The matrix describes a matrix for a risk target. The matrix is built from lists of frequency, consequence, and matrix cell objects along with a few other links. For user friendliness, the name and unit of the risk target is provided as read-only fields on the matrix resource.
Structure
A Matrix is made up of the following parts:
| Name | Type | Read-Only | Required | Comment |
|---|---|---|---|---|
| id | integer | yes | The id of the Evaluation | |
| project | integer | yes | The id of the project in which the matrix is defined | |
| risk_target | integer | yes | The id of the related risk target | |
| rows | integer | yes | The number of rows (frequencies) in the matrix | |
| columns | integer | yes | The number of columns (consequences) in the matrix | |
| is_opportunity | boolean | no | yes | whether or not the matrix is an opportunity matrix |
| consequence_display | integer | no | yes | Governs how consequence descriptions are displayed - 10: user defined description - 20: percentiles - 30: absolute values |
| frequency_display | integer | no | yes | Governs how frequency descriptions are displayed - 10: user defined description - 20: absolute values |
| percentile_low | decimal | no | Lower percentile used for scaling with budget | |
| percentile_mid | decimal | no | Middle percentile used for scaling with budget | |
| percentile_high | decimal | no | Higher percentile used for scaling with budget | |
| explicit_evaluation | boolean | no | yes | Whether or not the matrix is explicitly evaluated |
| scale_with_budget | boolean | no | yes | Whether or not to scale consequence classes with budget |
| budget | decimal | no | no | The allocated budget for the risk target |
| risk_reserve | decimal | no | no | The available risk reserve for the risk target |
| frequencies | Frequency list | yes | A list of frequencies for the matrix | |
| consequences | Consequence list | yes | A list of consequences for the matrix | |
| cells | MatrixCell list | yes | A list of matrix cells for the matrix | |
| risk_target_name | string | yes | The name of the risk target for the matrix | |
| risk_target_unit | string | yes | The unit of the risk target for the matrix | |
| risk_target_description | string | yes | The description of the risk target for the matrix | |
| created_at | datetime | yes | The date and time that the action was created | |
| created_by | integer | yes | The id of the user that created the matrix | |
| updated_by | integer | yes | The id of the user that last updated the matrix | |
| sys_period | datetime range | yes | The time range in which this revision of the matrix is valid. An open-ended range marks that this is the current revision. |
List matrices
/api/v1/projects/{project_id}/matrices
Matrices in a specific project.
Matrices can be fetched by sending a GET request to the URL.
Single matrix
/api/v1/projects/{project_id}/matrices/{matrix_id}
A specific matrix in a specific project.
A matrix is fetched with a GET request to the URL.
List related evaluations
/api/v1/projects/{project_id}/matrices/{matrix_id}/evaluations
Evaluations can be fetched by sending a GET request to the URL and can be created with a POST request that follows the rules in the structure outlined in Evaluation.
MatrixCell
The MatrixCell describes a single cell in a risk matrix. It describes the row/column coordinate, the value and the color.
Structure
A MatrixCell is made up of the following parts:
| Name | Type | Read-Only | Required | Comment |
|---|---|---|---|---|
| id | integer | yes | The id of the Evaluation | |
| matrix | integer | yes | The id of the matrix of the cell | |
| row | integer | yes | The row index of the cell (starting from 1) | |
| column | integer | yes | The column index of the cell (starting from 1) | |
| color | integer | no | yes | The color of the cell: - 0: low (green) - 10: mid-low (yellow) - 20: mid-high (orange) - 30: high (red) |
| value | integer | no | yes | The cell value |
| created_at | datetime | yes | The date and time that the action was created | |
| created_by | integer | yes | The id of the user that created the action | |
| updated_by | integer | yes | The id of the user that last updated the action | |
| sys_period | datetime range | yes | The time range in which this revision of the action is valid. An open-ended range marks that this i the current revision. |
Frequency
The frequency describes the low/mid/high values for a single row in the matrix.
Structure
A Frequency is made up of the following parts:
| Name | Type | Read-Only | Required | Comment |
|---|---|---|---|---|
| id | integer | yes | The id of the Evaluation | |
| matrix | integer | yes | The id of the matrix of the frequency | |
| name | string | no | yes | The name of the frequency, e.g. "negligible" |
| description | string | no | yes | The description of the frequency, e.g. "don't act" |
| row | integer | yes | The row index of the frequency (starting from 1) | |
| low | float | no | yes | the "low" value for the low/mid/high range |
| mid | float | no | yes | the "mid" value for the low/mid/high range |
| high | float | no | yes | the "high" value for the low/mid/high range |
| created_at | datetime | yes | The date and time that the action was created | |
| created_by | integer | yes | The id of the user that created the action | |
| updated_by | integer | yes | The id of the user that last updated the action | |
| sys_period | datetime range | yes | The time range in which this revision of the action is valid. An open-ended range marks that this is the current revision. |
Consequence
The consequence describes the low/mid/high values for a single column in the matrix.
Structure
A Consequence is made up of the following parts:
| Name | Type | Read-Only | Required | Comment |
|---|---|---|---|---|
| id | integer | yes | The id of the Evaluation | |
| matrix | integer | yes | The id of the matrix of the consequence | |
| name | string | no | yes | The name of the consequence, e.g. "negligible" |
| description | string | no | yes | The description of the consequence, e.g. "Low impact" |
| column | integer | yes | The column index of the consequence (starting from 1) | |
| low | float | no | yes | the "low" value for the low/mid/high range |
| mid | float | no | yes | the "mid" value for the low/mid/high range |
| high | float | no | yes | the "high" value for the low/mid/high range |
| created_at | datetime | yes | The date and time that the action was created | |
| created_by | integer | yes | The id of the user that created the action | |
| updated_by | integer | yes | The id of the user that last updated the action | |
| sys_period | datetime range | yes | The time range in which this revision of the action is valid. An open-ended range marks that this is the current revision. |
Log Entry
The log entry is the resource that stores all the basic information for an entry in the log. Log entries register changes such as creation, update and deletion of other entities, and are produced automatically in the system. They are therefore read-only, except for the field "note" which can be updated. Log entries cannot be deleted.
Structure
A log entry is made up of the following parts:
| Name | Type | Read-Only | Required | Comment |
|---|---|---|---|---|
| id | integer | yes | The id of the Entry | |
| action | integer | yes | The id of the Action (if applicable) | |
| change_description | string | yes | A description of the change | |
| changed_by | string | yes | The name of the user that did the change | |
| changed_from | string | yes | The value before the change | |
| changed_to | string | yes | The value after the change | |
| control | integer | yes | The id of the Control (if applicable) | |
| date | datetime | yes | The date and time that the entry was created | |
| description_switch | integer | yes | The description switch for the entry * 10 = Cause * 20 = Risk * 30 = Effect * 40 = Notes |
|
| description_switch_display | string | yes | The label of the description switch | |
| evaluation_type | integer | yes | The evaluation type for the entrybr> * 10 = Gross * 20 = Present * 30 = Nett |
|
| evaluation_type_display | string | yes | The label of the evaluation type | |
| matrix | integer | yes | The id of the matrix (if applicable) | |
| note | string | no | yes | The note of the log |
| object_description | string | yes | The description of the object for the entry | |
| object_identifier | string | yes | The identifier of the object for the entry | |
| object_switch | integer | yes | The object being switched in the entry * 10 = Risk * 20 = Control * 30 = Action * 40 = RiskTarget |
|
| object_switch_display | string | yes | The label of the object being switched | |
| owner | string | yes | The owner of the object in the entry | |
| previous_owner | string | yes | The previous owner of object in the entry | |
| project | integer | yes | The id of the project in the entry | |
| risk | integer | yes | The id of the risk in the entry (if applicable) | |
| risk_target | integer | yes | The id of the risk_target in the entry (if applicable) | |
| risk_target_name | string | yes | The label of the risk_target in the entry | |
| target_description | string | yes | The description of the target in the entry | |
| type_switch | integer | yes | The type of switch in the entry * 10 = Title * 20 = Description * 21 = Cause created * 22 = Cause modified * 23 = Effect created * 24 = Effect modified * 25 = Cause attached * 26 = Cause detached * 27 = Effect attached * 28 = Effect detached * 30 = Status * 40 = Owner * 50 = Evaluation * 60 = Tag * 70 = Deadline * 80 = Attachment * 90 = Detachment * 120 = Create reference * 125 = Modify reference * 130 = Delete reference * 140 = Create comment * 150 = Modify comment * 160 = Delete comment * 170 = CAtag * 180 = Control occurrence * 190 = Create recurrence * 200 = Modify recurrence * 210 = Delete recurrence * 220 = Confidentiality * 230 = Control Cost * 240 = Risk Review * 500 = Change in User Defined Field * 501 = Deletion of User Defined Field * 502 = Renamed User Defined Field |
|
| type_switch_display | string | yes | The label for the type of switch in the entry | |
| user | integer | yes | The id of the user in the entry (if applicable) |
Example:
{
  "id": 1071753,
  "action": null,
  "change_description": "Evaluation changed on risk target Test",
  "changed_by": "Bob M. Smith",
  "changed_from": "None",
  "changed_to": "1.0 (1, 1)",
  "control": null,
  "date": "2017-01-02 12:45:39.542376Z",
  "description_switch": null,
  "description_switch_display": null,
  "evaluation_type": 20,
  "evaluation_type_display": "present",
  "matrix": 1234,
  "note": null,
  "object_description": "Risk description",
  "object_identifier": "Risk #1",
  "object_switch": 40,
  "object_switch_display": "Risk Target",
  "owner": null,
  "previous_owner": null,
  "project": 123,
  "risk": 12345,
  "risk_target": null,
  "risk_target_name": "Test",
  "target_description": "Risk description",
  "type_switch": 50,
  "type_switch_display": "Evaluation",
  "user": 1234
}
List entries
/api/v1/projects/{project_id}/entries
All entries in a specific project.
Entries can be fetched by sending a GET request to the URL.
Available filters
The list of entries can be filtered using the following query parameters:
| Parameter | Type | Description |
|---|---|---|
| from | date (YYYY-MM-DD) | Returns only entries dated on or after this date |
| to | date (YYYY-MM-DD) | Returns only entries dated on or before this date (inclusive of the entire day) |
Both parameters can be combined to define a date range, or used individually.
Example: GET /api/v2/projects/1/entries?from=2026-03-01&to=2026-03-31 returns all
entries created in March 2026.
Example: GET /api/v2/projects/1/entries?from=2026-03-05 returns all entries from
5 March 2026 onwards.
These filters are also available on the nested entry endpoints described below.
Single entry
/api/v1/projects/{project_id}/entries/{entry_id}
A specific entry in a project, identified by id.
An entry is fetched with a GET request to the URL and it can be modified with a PUT request that follows the rules in the structure above. Please notice that only the field note can be updated.
Entries related to an Action
/api/v1/projects/{project_id}/actions/{action_id}/entries
Retrieves a list of all the entries that are related to the action. The entries follow the structure outlined in Log Entry.
Entries related to a Control
/api/v1/projects/{project_id}/controls/{control_id}/entries
Retrieves a list of all the entries that are related to the control. The entries follow the structure outlined in Log Entry.
Entries related to a Risk
/api/v1/projects/{project_id}/risks/{risk_id}/entries
Retrieves a list of all the entries that are related to the risk. The entries follow the structure outlined in Log Entry.
Category
The category is the resource that stores all the basic information for a category of risk tags.
Structure
A category is made up of the following parts:
| Name | Type | Read-Only | Required | Comment |
|---|---|---|---|---|
| id | integer | yes | The id of the Category | |
| created_at | datetime | yes | The date and time that the category was created | |
| created_by | integer | yes | The id of the user that created the category | |
| name | string | no | yes | The name of the category |
| ordering | integer | no | yes | The ordering of the category |
| mandatory | boolean | no | yes | True if choosing a tag from this category is required |
| mutually_exclusive | boolean | no | yes | True if only one tag from this category can be chosen |
| project | integer | yes | The id of the project that the category belongs to. | |
| sys_period | datetime range | yes | The time range in which this revision of the category is valid. An open-ended range marks that this is the current revision. |
|
| updated_by | integer | yes | The id of the user that last updated the category |
Example:
{
  "id": 12,
  "sys_period": {
    "lower": "2017-01-02 12:45:39.542376",
    "upper": null
  },
  "created_at": "2017-01-02T12:34:56.123456Z",
  "name": "Category Name",
  "ordering": 1,
  "mandatory": true,
  "mutually_exclusive": false,
  "created_by": 123,
  "updated_by": 234,
  "project": 12
}
List categories
/api/v1/projects/{project_id}/categories
Categories can be fetched by sending a GET request to the URL and can be created with a POST request that follows the rules in the structure above. Note that only Project Admins can create new categories.
Single category
/api/v1/projects/{project_id}/categories/{category_id}
A specific category in a project.
A category is fetched with a GET request to the URL and it can be modified with a PUT request that follows the rules in the structure above. A DELETE request to the URL will delete the category and all its tags. Note that only Project Admins can update and delete a Category.
Tag
The tag is the resource that stores all the basic information for a risk tag.
Structure
A tag is made up of the following parts:
| Name | Type | Read-Only | Required | Comment |
|---|---|---|---|---|
| id | integer | yes | The id of the tag | |
| category | integer | no | yes | The category of the tag |
| category_name | string | yes | The category label of the tag | |
| created_at | datetime | yes | The date and time that the tag was created | |
| created_by | integer | yes | The id of the user that created the tag | |
| name | string | no | yes | The name of the tag |
| ordering | integer | no | yes | The ordering of the tag |
| project | integer | yes | The id of the project that the tag belongs to. | |
| sys_period | datetime range | yes | The time range in which this revision of the tag is valid. An open-ended range marks that this is the current revision. |
|
| updated_by | integer | yes | The id of the user that last updated the tag |
Example:
{
  "id": 12,
  "category_name": "Category Name",
  "sys_period": {
    "lower": "2017-01-02 12:45:39.542376",
    "upper": null
  },
  "created_at": "2017-01-02T12:34:56.123456Z",
  "name": "Tag Name",
  "ordering": 1,
  "created_by": 123,
  "updated_by": 234,
  "project": 12,
  "category": 23
}
List tags
/api/v1/projects/{project_id}/tags
Tags can be fetched by sending a GET request to the URL and can be created with a POST request that follows the rules in the structure above. Note that only Project Admins can create a new tag.
Single tag
/api/v1/projects/{project_id}/tags/{tag_id}
A specific tag in a project, referenced by its id.
A tag is fetched with a GET request to the URL and it can be modified with a PUT request that follows the rules in the structure above. Note that only Project Admins can update a tag.
CACategory
The CACategory is the resource that stores all the basic information for a category of control and action tags.
Structure
A CACategory is made up of the following parts:
| Name | Type | Read-Only | Required | Comment |
|---|---|---|---|---|
| id | integer | yes | The id of the CACategory | |
| created_at | datetime | yes | The date and time that the CACategory was created | |
| created_by | integer | yes | The id of the user that created the CACategory | |
| name | string | no | yes | The name of the CACategory |
| ordering | integer | no | yes | The ordering of the CACategory |
| mandatory | boolean | no | yes | True if choosing a tag from this CACategory is required |
| mutually_exclusive | boolean | no | yes | True if only one tag from this CACategory can be chosen |
| project | integer | yes | The id of the project that the CACategory belongs to. | |
| sys_period | datetime range | yes | The time range in which this revision of the tag is valid. An open-ended range marks that this is the current revision. |
|
| updated_by | integer | yes | The id of the user that last updated the CACategory |
Example:
{
  "id": 12,
  "sys_period": {
    "lower": "2017-01-02 12:45:39.542376",
    "upper": null
  },
  "created_at": "2017-01-02T12:34:56.123456Z",
  "name": "CaCategory Name",
  "ordering": 1,
  "mandatory": false,
  "mutually_exclusive": true,
  "created_by": 123,
  "updated_by": 234,
  "project": 12
}
List CACategories
/api/v1/projects/{project_id}/cacategories
CACategories can be fetched by sending a GET request to the URL and can be created with a POST request that follows the rules in the structure above. Note that only Project Admins can create a new CACategory.
Single CACategory
/api/v1/projects/{project_id}/cacategories/{category_id}
A specific CACategory in a project.
A CACategory is fetched with a GET request to the URL and it can be modified with a PUT request that follows the rules in the structure above. A DELETE request to the URL will delete the CACategory and all its related tags. CACategories can be updated and deleted by Project Admins only.
CATag
The CATag is the resource that stores all the basic information for a control and action tag.
Structure
A CATag is made up of the following parts:
| Name | Type | Read-Only | Required | Comment |
|---|---|---|---|---|
| id | integer | yes | The id of the CAtag | |
| category | integer | no | yes | The category of the CAtag |
| category_name | string | yes | The category label of the CAtag | |
| created_at | datetime | yes | The date and time that the CAtag was created | |
| created_by | integer | yes | The id of the user that created the CAtag | |
| name | string | no | yes | The name of the CAtag |
| ordering | integer | no | yes | The ordering of the CAtag |
| project | integer | yes | The id of the project that the CAtag belongs to. | |
| sys_period | datetime range | yes | The time range in which this revision of the tag is valid. An open-ended range marks that this is the current revision. |
|
| updated_by | integer | yes | The id of the user that last updated the CAtag |
Example:
{
  "id": 12,
  "category_name": "Category Name",
  "sys_period": {
    "lower": "2017-01-02 12:45:39.542376",
    "upper": null
  },
  "created_at": "2017-01-02T12:34:56.123456Z",
  "name": "Tag Name",
  "ordering": 1,
  "created_by": 123,
  "updated_by": 234,
  "project": 12,
  "category": 23
}
List CATags
/api/v1/projects/{project_id}/catags
CATags can be fetched by sending a GET request to the URL and can be created with a POST request that follows the rules in the structure above. Note that only Project Admins can create a new CATag.
Single CATag
/api/v1/projects/{project_id}/catags/{tag_id}
A specific CATag in a project.
A CATag is fetched with a GET request to the URL and it can be modified with a PUT request that follows the rules in the structure above. CATags can also be deleted with a DELETE request to the URL. Note that only Project Admins can update and delete CATags.
Reference
The reference is the resource that stores all the basic information for a reference.
Structure
A reference is made up of the following parts:
| Name | Type | Read-Only | Required | Comment |
|---|---|---|---|---|
| id | integer | yes | The id of the reference | |
| backwards | boolean | yes | If the reference goes from a specified object (action, control, risk), this will be true, otherwise false. |
|
| created_at | datetime | yes | The date and time that the reference was created | |
| created_by | integer | yes | The id of the user that created the reference | |
| description | string | no | The description of the reference | |
| from_action | integer | no | The action id that the reference is referenced from | |
| from_control | integer | no | The control id that the reference is referenced from | |
| from_risk | integer | no | The risk id that the reference is referenced from | |
| project | integer | yes | The id of the project that the reference belongs to | |
| project_name | string | yes | The label of the project that the reference belongs to | |
| repr | string | yes | A short explanation of the reference | |
| sys_period | datetime | yes | The time range in which this revision of the tag is valid. An open-ended range marks that this is the current revision. |
|
| to_action | integer | no | The action id that the reference is referencing | |
| to_control | integer | no | The control id that the reference is referencing | |
| to_file | file | no | The file that the reference is referencing | |
| to_link | string | no | The link that the reference is referencing | |
| to_project | integer | yes | The project id of the referenced object (action, control or risk) | |
| to_project_name | string | yes | The label of the project of the referenced object (action, control or risk) | |
| to_risk | integer | no | The risk id that the reference is referencing | |
| updated_by | integer | yes | The id of the user that last updated the reference | |
| url | string | yes | The URL of the reference |
Note that when creating a new Reference, exactly only one among the fields [to_action]{.title-ref}, [to_control]{.title-ref}, [to_file]{.title-ref}, [to_link]{.title-ref}, [to_risk]{.title-ref} needs to be specified.
Example:
{
  "id": 1,
  "repr": "Control #1 Controller Title",
  "url": "/2/controls/?control_id=1",
  "description": "",
  "to_project_name": "Ramrisk Project",
  "project_name": "Ramrisk Project",
  "backwards": true,
  "sys_period": {
    "lower": "2017-01-02 12:45:39.542376",
    "upper": null
  },
  "created_at": "2017-01-02 12:45:39.542376",
  "to_link": null,
  "to_file": null,
  "created_by": 3,
  "updated_by": 4,
  "from_risk": null,
  "from_control": 1,
  "from_action": null,
  "to_risk": 3,
  "to_control": null,
  "to_action": null,
  "project": 2,
  "to_project": 2
}
Map Features
A map feature is a resource that stores all the basic information for a map feature. A map feature is a point on a map that can be used to represent a location of interest, such as a risk or control.
Structure
A Map Feature is made up of the following parts:
| Name | Type | Read-Only | Required | Comment |
|---|---|---|---|---|
| id | integer | yes | The id of the map feature | |
| guid | string | yes | A unique GUID value to identify the map feature across several systems | |
| title | string | no | yes | The title of the map feature |
| description | string | no | yes | The description of the map feature |
| latitude | float | no | yes | The latitude of the map feature |
| longitude | float | no | yes | The longitude of the map feature |
| altitude | float | no | yes | The altitude of the map feature |
| rotation | float | no | yes | The rotation of the map feature |
| bim_model_type | integer | no | yes | The BIM model type of the map feature |
| geometry_object_type | integer | no | yes | The geometry object type of the map feature |
| target_object_id | integer | no | yes | The target object id of the map feature |
| target_object_type_id | integer | no | yes | The target object type of the map feature |
| coordinate_system_id | integer | no | yes | The coordinate system of the map feature |
List MapFeatures
/api/v1/projects/{project_id}/mapfeatures
Can be fetched by sending a GET request to the URL and can be created with a POST request that follows the rules in the structure above.
Allows for posting of a new map feature to the project:
{
  "title": "Map Feature Title",
  "description": "Map Feature Description",
  "latitude": 12.345,
  "longitude": 12.345,
  "altitude": 12.345,
  "rotation": 12.345,
  "bim_model_type": 1,
  "geometry_object_type": 1,
  "target_object_id": 1,
  "target_object_type_id": 1,
  "coordinate_system_id": 1
}
Single MapFeature
/api/v1/projects/{project_id}/mapfeatures/{mapfeature_id}
A MapFeature is fetched with a GET request to the URL, and it can be modified with a PUT request that follows the rules in the structure above
List MapFeatures for Risk
/api/v1/projects/{project_id}/risk/{risk_id}/mapfeatures?coordinate_system_id={coordinate_system_id}
Returns a list of map features for the given risk in Json format. Specifying the coordinate system id is optional. By default, the map features are turned into the coordinate system of the project. If the coordinate_system_id is specified, then the map features are turned into the specified coordinate system. The options for the coordinate_system_id can be retrieved by issuing an OPTIONS request at the URL.
Example output format:
{
  "count": 1,
  "next": null,
  "previous": null,
  "results": [
    {
      "id": 1234,
      "guid": "xxxxxxxxxxxxxxxxxxxxx",
      "title": "Map Feature Title",
      "description": "Map Feature Description",
      "latitude": 12.345,
      "longitude": 12.345,
      "altitude": 12.345,
      "rotation": 12.345,
      "bim_model_type": 1,
      "geometry_object_type": 1,
      "target_object_id": 1,
      "target_object_type_id": 1,
      "coordinate_system_id": 1
    }
  ]
}
Supports the OPTIONS call, in which case a JSON response is provided with the possible values for the fields bim_model_type, geometry_object_type, target_object_type_id, and coordinate_system_id.
Bim model type options:
"bim_model_type": {
"type": "choice",
"required": true,
"read_only": false,
"label": "Bim model type",
"choices": [
{
"value": 10,
"display_name": "Cube"
},
{
"value": 20,
"display_name": "RAM (risk)"
},
{
"value": 30,
"display_name": "Safety (risk)"
},
{
"value": 40,
"display_name": "RAM (control)"
},
{
"value": 50,
"display_name": "Safety (control)"
},
{
"value": 60,
"display_name": "Helmet"
}
]
}
}
Geometry object type options:
"geometry_object_type": {
"type": "choice",
"required": true,
"read_only": false,
"label": "Geometry object type",
"choices": [
{
"value": 10,
"display_name": "Point - single position"
},
{
"value": 20,
"display_name": "LineString - array of positions"
},
{
"value": 30,
"display_name": "MultiPoint - array of positions"
},
{
"value": 40,
"display_name": "Polygon - array of arrays of positions"
},
{
"value": 50,
"display_name": "MultiLineString - array of arrays of positions"
},
{
"value": 60,
"display_name": "MultiPolygon - multidimensional array of positions"
}
]
}
Target object type options:
"target_object_type_id": {
"type": "field",
"required": true,
"read_only": false,
"label": "Target object type id",
"choices": [
{
"display_name": "controls | control",
"value": 25
},
{
"display_name": "hazards | risk",
"value": 16
}
]
}
Coordinate system options:
"coordinate_system": {
"type": "choice",
"required": true,
"read_only": false,
"label": "Coordinate system",
"choices": [
{
"value": 10,
"display_name": "ED50 / UTM zone 32N"
},
{
"value": 20,
"display_name": "ETRS-GK22"
},
{
"value": 30,
"display_name": "ETRS89 / ETRS-GK22FIN"
},
{
"value": 35,
"display_name": "ETRS89 / ETRS-GK23FIN"
},
{
"value": 40,
"display_name": "ETRS89 / ETRS-GK26FIN"
},
{
"value": 45,
"display_name": "ETRS89 / GK23FIN (3877)"
},
{
"value": 50,
"display_name": "ETRS89 / GK24FIN"
},
{
"value": 60,
"display_name": "ETRS89 / GK25FIN"
},
{
"value": 70,
"display_name": "ETRS89 / GK26FIN"
},
{
"value": 80,
"display_name": "ETRS89/TM35FIN"
},
{
"value": 90,
"display_name": "ETRS89 / TM35FIN(N,E)"
},
{
"value": 100,
"display_name": "KKJ"
},
{
"value": 110,
"display_name": "KKJ / Finland Zone 1"
},
{
"value": 120,
"display_name": "KKJ / Finland Zone 2"
},
{
"value": 130,
"display_name": "NTM zone 10"
},
{
"value": 140,
"display_name": "NTM zone 11"
},
{
"value": 150,
"display_name": "Pseudo-Mercator"
},
{
"value": 160,
"display_name": "WGS-84 (GPS system)"
}
]
}
Post a new MapFeature for risk or control
To post a new map feature for either a risk or a control object, issue a POST request to the list endpoint for the respective object. The request body should contain the following format:
{
  "title": "",
  "description": "",
  "latitude": null,
  "longitude": null,
  "altitude": null,
  "rotation": null,
  "bim_model_type": null,
  "geometry_object_type": null,
  "target_object_id": null,
  "target_object_type_id": null,
  "coordinate_system": null
}
List MapFeatures for Control
/api/v1/projects/{project_id}/control/{control_id}/mapfeatures
Returns a list of map features for the given control in Json format:
Example output format:
{
    "count": 1,
    "next": null,
    "previous": null,
    "results": [
        {
            "id": 1234,
            "guid": "xxxxxxxxxxxxxxxxxxxxx",
            "title": "Map Feature Title",
            "description": "Map Feature Description",
            "latitude": 12.345,
            "longitude": 12.345,
            "altitude": 12.345,
            "rotation": 12.345,
            "bim_model_type": 1,
            "geometry_object_type": 1,
            "target_object_id": 1,
            "target_object_type_id": 1,
            "coordinate_system_id": 1
        }
    ]
}
Meta endpoints
While RamRisk provides much of what is necessary for developers to integrate with their own services, there are some cases where a system might need to be able to store information, which does not fit into the data models that are described in this document so far. To accommodate such cases, we have added the concept of META endpoints. These provide a way to store any JSON object desired on specific data models in the system, for easy retrieval later.
Specifically, it is possible to save JSON objects on individual projects, risks, controls, or actions. These JSON objects can be individually retrieved, updated, or deleted, and can additionally be retrieved by their related objects type, e.g. you can retrieve the JSON objects stored for risk #1 in project #1, or you can retrieve all JSON objects from any risk on project #1, etc.
The reason for making the META object available for these four types is that they each help provide access control, restricting access to projects by roles and restricting access to risks/controls/actions by confidentiality settings. The rules that apply to these types also apply to their respective META objects
Another important point when trying to access these endpoints is that you need to specify a custom HTTP header. Since multiple integrated applications or multiple users with different interest may store META objects on the same URLs, it is important to make sure that they don't access/overwrite each others data. To that end, each of the endpoints are masked by an API App ID, which needs to be generated from the contract page. Once an application ID is generated, you will need to provide an HTTP header like "X-APP-ID: \<my_app_id>". If you do not provide such a key, you will be presented with a "BAD REQUEST" response.
Structure
A META object is made up of the following parts:
| Name | Type | Read-Only | Required | Comment |
|---|---|---|---|---|
| created_at | datetime | yes | Time of creation of the META object | |
| updated_at | datetime | yes | Time of last update to the META object | |
| data | JSON | no | no | A JSON object defined by the API user. |
| object_id | number | yes | The primary key of the related object. | |
| content_type | string | yes | The type of the related object, either. "project", "risk", "control", or "action" |
Example:
{
  "id": 28900,
  "created_at": "2017-01-02 12:45:39.542376",
  "updated_at": "2017-01-02 12:45:39.542376",
  "content_type": "risk",
  "object_id": 42,
  "data": {
    "foo": "bar"
  }
}
Listing META objects
/api/v1/projects/meta
List meta objects for all projects the user has access to.
/api/v1/projects/{project_id}/risks/meta
List meta objects for all risks of the given project.
/api/v1/projects/{project_id}/controls/meta
List meta objects for all controls of the given project.
/api/v1/projects/{project_id}/actions/meta
List meta objects for all controls of the given project.
Single META object
/api/v1/projects/{project_id}/meta
Retrieve the META object for the specific project.
/api/v1/projects/{project_id}/risks/{risk_id}/meta
Retrieve the META object for the specific risk.
/api/v1/projects/{project_id}/controls/{control_id}/meta
Retrieve the META object for the specific risk.
/api/v1/projects/{project_id}/actions/{action_id}/meta
Retrieve the META object for the specific risk.
Reporting
Report elements can be retrieved through the API. For List elements, the data requested will be provided in JSON format, while in the case of plots and diagrams (Statistics), the response will contain the data necessary to reproduce the figures, still in JSON format. All Report Elements can be provided with filter data, sorting data, and a list of timestamps. Options will be individual for each element. For specifications about options format and structure of the returned information please refer to the following sections.
Filter Structure
Each of the following entries will accept a POST request containing a JSON object as a payload, with the following structure:
Version 1
| Name | Type | Required | Description |
|---|---|---|---|
| filter | dict | no | A dict of filter options to be applied to the element, as specified in the following section. |
| ordering | dict | no | A dict of options specifying the ordering of the results, in the format specified in the following section. |
| labels | dict | no | A dict of ids of existing labels (timestamps) |
| project_group | integer | yes | The id of the project group containing the data for which to produce a report element |
| opts | dict | no | A dict of options for the specific element |
When requesting a report element, all the data that is requested needs to be inside the scope of the project group added to the filter.
Example:
{
  "project_group": 123,
  "filter": {
    "text_search": "Risk"
  },
  "ordering": {
    "actions": [
      "action_number"
    ],
    "controls": [
      "control_number"
    ],
    "risks": [
      "risk_number"
    ]
  },
  "labels": {
    "label_selection_type": "manual",
    "labels": [
      1,
      2
    ]
  },
  "opts": {}
}
Version 2
| Name | Type | Required | Description |
|---|---|---|---|
| filter | dict | no | A dict of filter options to be applied to the element, as specified in the following section. |
| ordering | dict | no | A dict of options specifying the ordering of the results, in the format specified in the following section |
| timestamps | dict | no | A dict of ids of existing timestamps (labels) |
| project_group | integer | yes | The id of the project group containing the data for which to produce a report element |
| opts | dict | no | A dict of options for the specific element |
In version 2 of the api, the report filter option for timestamps has been renamed from "labels" to "timestamps". All the other elements remain the same.
Example:
{
  "project_group": 123,
  "filter": {
    "text_search": "Risk"
  },
  "ordering": {
    "actions": [
      "action_number"
    ],
    "controls": [
      "control_number"
    ],
    "risks": [
      "risk_number"
    ]
  },
  "timestamps": {
    "timestamp_selection_type": "manual",
    "timestamps": [
      1,
      2
    ]
  },
  "opts": {}
}
Filter
Each single option of the form option_name:option_value specified in
the filter needs to be encapsulated in the following way:
{
  "option_name": "option_value"
}
Boolean options (True or False values) can be left out from the filter if not active.
In case of options that contain lists, the option_value will be a list of values needed in the filter.
Names for filter options are:
| Area | Name | Type | Required | Description |
|---|---|---|---|---|
| Risk | text_search | string | Text associated with the risks. Only risks related to this value will be included. The value can be either a number sequence/range, e.g. "1,2,3,5-9" or |
|
| filter_status | list | A list of status codes to be applied to a risk. Codes are: * 10: New * 20: Open * 30: Closed * 40: Discarded |
||
| owners | list | A list of ids of desired Risk owners | ||
| tags | list | A list of ids of desired Risk tags | ||
| confidentiality | list | A list specifying whether to filter confidential risks or not confidential or both. If left blank, both types will be included in the result. Accepted values are: * "conf": for confidential * "nonconf": for not confidential |
||
| evaluation | list | A list of RiskTarget ids | ||
| verbosity_level | int | Level of Risk verbosity (VerbosityLevels) | ||
| Control | text_search | string | Text associated with the controls. Only controls related to this value will be included. The value can be either a number sequence/range, e.g. "1,2,3,5-9" or other text, which will search in title and description |
|
| unattached_controls | boolean | A boolean specifying whether to include unattached controls in the result | ||
| control_apply_risk_filter | boolean | A boolean specifying whether to apply the risk filter to controls | ||
| filter_control_status | list | A list of accepted status codes for controls. Codes are: * 10: Possible * 20: Planned * 30: Ongoing * 40: Done * 50: Discarded |
||
| control_owners | list | A list of ids of desired Control owners | ||
| control_tags | list | A list of ids of tags for the Control | ||
| control_costs | list | A list of ids of RiskTargets where the Control has ControlCosts | ||
| Action | text_search | string | Text associated with the actions. Only actions related to this value will be included. The value can be either a number sequence/range, e.g. "1,2,3,5-9" or other text, which will search in title and description |
|
| action_apply_risk_filter | boolean | A boolean that specifies whether to apply the risk filter to actions | ||
| action_apply_control_filter | boolean | A boolean specifying whether to apply the control filter to actions | ||
| filter_action_status | list | A list of accepted status codes for actions. Codes are: * 10: Possible * 20: Planned * 30: Ongoing * 40: Done * 50: Discarded |
||
| action_owners | list | A list of ids of desired Action owners | ||
| action_tags | list | A list of tag ids for the Action |
Ordering
Each single ordering option is added to the area they belong. The format is shown below:
{
  "actions": [
    "-option_value",
    "option_value"
  ],
  "risks": [
    "option_value",
    "-option_value"
  ]
}
Values should just be strings. Ascending is default ordering. Add - in
front of option_value to order descending.
Option values can be one or more of the following:
| Model | Descending | Option Values |
|---|---|---|
| Risk | - | risk_number worst_risk_eval__eval_level best_risk_eval__eval_level owner date status title project_title udf_{id} evaluation_matrix_{id} |
| Control | - | control_number owner deadline status description project_title udf_{id} |
| Action | - | action_number owner deadline status description project_title |
| Cause | - | number text project_title |
| Effect | - | number text project_title |
Example:
{
  "risks": [
    "-owner",
    "risk_number"
  ]
}
This example will order owner in descending order and then risks by risk_number ascending order
Timestamps
Each single timestamp (label) ID included in the filter needs to be added to the timestamp list:
Version 1 (v1)
{
  "labels": [
    40,
    41
  ]
}
Version 2 (v2)
{
  "timestamps": [
    40,
    41
  ]
}
Additionally, it is possible to request all timestamps to be applied to the report by adding the following option:
Version 1 (v1)
{
  "label_selection_type": "all"
}
Version 2 (v2)
{
  "timestamp_selection_type": "all"
}
Timestamp (label) ids can be created, retrieved, updated, and destroyed through the API at the following URLS.
/api/v1/projects/{project_key}/labels
/api/v2/projects/{project_key}/timestamps
GETs a list of timestamps in the project and POSTs a new timestamp (label) to the project.
/api/v1/projects/{project_key}/labels/{id}
/api/v2/projects/{project_key}/timestamps/{id}
GETs, modifies and deletes an individual timestamp (label).
/api/v1/users/{user_key}/labels
/api/v2/users/{user_key}/timestamps
GETs a list of timestamps in the project and POSTs a new timestamp to the user.
/api/v1/users/{user_key}/labels/{id}
/api/v2/users/{user_key}/timestamps/{id}
GETs, modifies and deletes an individual timestamp.
Structure
A timestamp (label) is made up of the following parts:
| Name | Type | Comment |
|---|---|---|
| id | integer | The id of the timestamp. |
| project | integer | The project of the timestamp (if created in single-project scope). |
| user | integer | The user of the timestamp (if created in cross-project scope). |
| date | datetime | The date of the timestamp. |
| title | string | The title of the timestamp. |
Action List
/api/v1/reporting/action_list
Action List report elements can be fetched by POSTing the filter options to the URL above.
Options
It is possible to specify the following options for the Action List report element:
| Name | Type | Required | Description |
|---|---|---|---|
| actionlist-max_actions | number | The maximum number of actions to include in the results. | |
| actionlist-reference_choice | list | Include references to/from actions if provided. * "to": Include to-references * "from": Include from-references |
Example v1:
{
  "project_group": 123,
  "filter": {
    "action_text_search": "Action"
  },
  "ordering": {
    "actions": [
      "action_number"
    ]
  },
  "labels": {
    "labels": [
      1,
      2
    ]
  },
  "opts": {
    "actionlist-max_actions": 10
  }
}
Example v2:
{
  "project_group": 123,
  "filter": {
    "action_text_search": "Action"
  },
  "ordering": {
    "actions": [
      "action_number"
    ]
  },
  "timestamps": {
    "timestamps": [
      1,
      2
    ]
  },
  "opts": {
    "actionlist-max_actions": 10
  }
}
Barplot
/api/v1/reporting/barplots
Barplot report elements can be fetched by POSTing the filter options to the URL above.
Options
It is possible to specify the following options for the Barplot report element:
| Name | Type | Required | Description |
|---|---|---|---|
| matrices | list | The ids of the matrices that should be used to create barplot elements. Also valid: * "worst_risk_type" * "best_risk_type" |
|
| eval_types | list | A list of accepted evaluation types. Codes are: * 10: Gross * 20: Present * 30: Nett |
Example v1:
{
  "project_group": 123,
  "filter": {},
  "ordering": {},
  "labels": {
    "labels": [
      1
    ]
  },
  "opts": {
    "matrices": [
      1,
      2,
      3,
      "worst_risk_type"
    ],
    "eval_types": [
      10,
      20
    ]
  }
}
Example v2:
{
  "project_group": 123,
  "filter": {},
  "ordering": {},
  "timestamps": {
    "timestamps": [
      1
    ]
  },
  "opts": {
    "matrices": [
      1,
      2,
      3,
      "worst_risk_type"
    ],
    "eval_types": [
      10,
      20
    ]
  }
}
Estimated Value of Controls
/api/v1/reporting/control_value
Estimated Value of Control report elements can be fetched by POSTing the filter options to the URL above.
Options
It is possible to specify the following options for the Estimated Value of Control report element:
| Name | Type | Required | Description |
|---|---|---|---|
| matrices | list | The ids of the matrices that should be used to create the element. | |
| subtract_costs | boolean | Whether to include control costs in the element or not. |
Example v1:
{
  "project_group": 123,
  "filter": {},
  "ordering": {},
  "labels": {
    "labels": [
      1
    ]
  },
  "opts": {
    "matrices": [
      1,
      2,
      3
    ],
    "subtract_costs": true
  }
}
Example v2:
{
  "project_group": 123,
  "filter": {},
  "ordering": {},
  "timestamps": {
    "timestamps": [
      1
    ]
  },
  "opts": {
    "matrices": [
      1,
      2,
      3
    ],
    "subtract_costs": true
  }
}
Control List
/api/v1/reporting/control_list
Control List report elements can be fetched by POSTing the filter options to the URL above.
Options
It is possible to specify the following options for the Control List report element:
| Name | Type | Required | Description |
|---|---|---|---|
| controllist-max_controls | number | The maximum number of controls to include in the results. | |
| controllist-reference_choice | list | Include references to/from controls if provided. * "to": Include to-references * "from": Include from-references |
|
| controllist-status | boolean | Include control status in the report. | |
| controllist-owner | boolean | Include control owner in the report. | |
| controllist-deadline | boolean | Include control deadline in the report. | |
| controllist-comments | boolean | Include control comments in the report. | |
| controllist-risks | boolean | Include related risks in the report. | |
| controllist-actions | boolean | Include related actions in the report. | |
| controllist-tags | boolean | Include control tags in the report. | |
| controllist-costs | boolean | Include control costs in the report. | |
| controllist-causes | boolean | Include related causes in the report. | |
| controllist-effects | boolean | Include related effects in the report. | |
| controllist-cause_status | boolean | Include status of each related cause. | |
| controllist-effect_status | boolean | Include status of each related effect. |
Example:
{
  "project_group": 123,
  "filter": {
    "control_text_search": "Control"
  },
  "ordering": {
    "actions": [
      "control_number"
    ]
  },
  "opts": {
    "controllist-max_controls": 10
  }
}
Matrix
/api/v1/reporting/matrix
Matrix report elements can be fetched by POSTing the filter options to the URL above.
Options
It is possible to specify the following options for the Matrix report element:
| Name | Type | Required | Description |
|---|---|---|---|
| matrices | list | The ids of the matrices that should be used to create matrix elements.br>Also valid: * "worst_risk_type" * "best_risk_type" |
|
| previous_timestamp | boolean | Boolean that indicates whether to include previous timestamps. If set to true, a minimum of 2 labels/timestamps is required. |
|
| eval_types | list | A list of accepted evaluation types. Codes are: * 10: Gross * 20: Present * 30: Nett |
|
| project_for_layout | int | The project id to base the matrix calculations to. |
Example v1:
{
  "project_group": 123,
  "filter": {},
  "ordering": {},
  "labels": {
    "labels": [
      1,
      2
    ]
  },
  "opts": {
    "previous_timestamp": true,
    "eval_types": [
      10,
      20,
      30
    ]
  }
}
Example v2:
{
  "project_group": 123,
  "filter": {},
  "ordering": {},
  "timestamps": {
    "timestamps": [
      1,
      2
    ]
  },
  "opts": {
    "previous_timestamp": true,
    "eval_types": [
      10,
      20,
      30
    ]
  }
}
Ownership Change List
/api/v1/reporting/ownership_change
Ownership Change list can be fetched by POSTing the filter options to the URL above.
Options
No options for this report element.
Ownership Statistics
/api/v1/reporting/ownership
Ownership Statistics report elements can be fetched by POSTing the filter options to the URL above.
Options
No options for this report element.
Project Information
/api/v1/reporting/project_information
Project Information report elements can be fetched by POSTing the filter options to the URL above.
Options
No options for this report element.
Risk List
/api/v1/reporting/risk_list
Risk List report elements can be fetched by POSTing the filter options to the URL above.
Options
It is possible to specify the following options for the Risk List report element:
| Name | Type | Required | Description |
|---|---|---|---|
| list_type | string | A list of accepted list types. Types are: * normal * new * closed * discarded * increased * decreased |
|
| max_risks | number | The maximum number of risks to include in the results | |
| risk_targets | string/ integer |
A single matrix id that specifies whether to include evaluations on it. Other values can be: * "none": None * "all_risklevels": All evaluations * "risklevel": Highest Risk Level * "bestrisklevel": Highest Opportunity Level |
|
| eval_types | list | A list of accepted evaluation types.br>Codes are: * 10: Gross * 19: Previous * 20: Present * 30: Nett |
|
| use_previous | boolean | If true, at least 2 labels/timestamps are required. | |
| reference_choice | list | Include references to/from risks if provided. * to: Include to-references * from: Include from-references |
|
| cause | boolean | Include cause descriptions in the report. | |
| cause_status | boolean | Include cause status in the report. | |
| effect | boolean | Include effect descriptions in the report. | |
| effect_status | boolean | Include effect status in the report. |
Example:
{
  "project_group": 123,
  "filter": {
    "text_search": "Risk"
  },
  "ordering": {
    "risks": [
      "risk_number"
    ]
  },
  "opts": {
    "max_risks": 20,
    "risk_targets": 1
  }
}
S-Curve
/api/v1/reporting/scurve
S-Curve report elements can be fetched by POSTing the filter options to the URL above.
Options
It is possible to specify the following options for the S-Curve report element:
| Name | Type | Required | Description |
|---|---|---|---|
| matrices | list | The ids of the matrices that should be used to create matrix elements. | |
| include_budget | boolean | Boolean that indicates whether to include budget or not. | |
| percentiles | list | A list of accepted percentiles. Percentiles are: * 0.05: 5% * 0.10: 10% * 0.15: 15% * 0.20: 20% * 0.25: 25% * 0.30: 30% * 0.35: 35% * 0.40: 40% * 0.45: 45% * 0.50: 50% * 0.55: 55% * 0.60: 60% * 0.65: 65% * 0.70: 70% * 0.75: 75% * 0.80: 80% * 0.85: 85% * 0.90: 90% * 0.95: 95% |
|
| eval_types | list | A list of accepted evaluation types. Codes are: * 10: Gross * 20: Present * 30: Nett |
Example:
{
  "project_group": 123,
  "filter": {},
  "ordering": {},
  "opts": {
    "matrices": [
      1,
      2
    ],
    "include_budget": true,
    "percentiles": [
      0.05,
      0.20,
      0.70
    ],
    "eval_types": [
      10,
      20,
      30
    ]
  }
}
Monte Carlo Simulation
/api/v1/reporting/monte_carlo
Monte Carlo Simulation report elements can be fetched by POSTing the filter options to the URL above.
Options
It is possible to specify the following options for the Monte Carlo Simulation report element:
| Name | Type | Required | Description |
|---|---|---|---|
| matrices | list | The ids of the matrices that should be used to create matrix elements. | |
| percentiles | list | A list of accepted percentiles. Percentiles are: * 0.05: 5% * 0.10: 10% * 0.15: 15% * 0.20: 20% * 0.25: 25% * 0.30: 30% * 0.35: 35% * 0.40: 40% * 0.45: 45% * 0.50: 50% * 0.55: 55% * 0.60: 60% * 0.65: 65% * 0.70: 70% * 0.75: 75% * 0.80: 80% * 0.85: 85% * 0.90: 90% * 0.95: 95% |
|
| simulations | integer | How many simulations should be performed. Minimum 1 <=> 10.000 Maximum |
|
| eval_types | list | A list of accepted evaluation types. Codes are: * 10: Gross * 20: Present * 30: Nett |
Example
{
  "project_group": 123,
  "filter": {},
  "ordering": {},
  "opts": {
    "matrices": [
      1,
      2
    ],
    "percentiles": [
      0.05,
      0.20,
      0.70
    ],
    "simulations": 2000,
    "eval_types": [
      10,
      20,
      30
    ]
  }
}
Status Statistics
/api/v1/reporting/status
Status Statistics report elements can be fetched by POSTing the filter options to the URL above.
Options
No options for this report element.
Tornado diagram - top risk contributors
/api/v1/reporting/risk_value_contributions
Tornado report elements can be fetched by POSTing the filter options to the URL above.
Options
It is possible to specify the following options for the Tornado report element:
| Name | Type | Required | Description |
|---|---|---|---|
| matrices | list | The ids of the matrices that should be used to create tornado elements. | |
| max_risks | number | One of accepted numbers. Numbers are: * 5 * 10 * 15 * 20 * 50 |
|
| eval_types | list | A list of accepted evaluation types. Codes are: * 10: Gross * 20: Present * 30: Nett |
Example
{
  "project_group": 123,
  "filter": {},
  "ordering": {},
  "opts": {
    "matrices": [
      1,
      2
    ],
    "max_risks": 10,
    "eval_types": [
      10,
      20,
      30
    ]
  }
}
Value at Risk
/api/v1/reporting/valueatrisks
Value at Risk report elements can be fetched by POSTing the filter options to the URL above.
Options
It is possible to specify the following options for the Value at Risk report element:
| Name | Type | Required | Description |
|---|---|---|---|
| matrices | list | The ids of the matrices that should be used to create VaR elements. | |
| categories | list | Category ids will be used to stack values, if provided. | |
| include_costs | bool | Whether or not to load the Cost of controls into the results. | |
| eval_types | list | A list of accepted evaluation types. Codes are: * 10: Gross * 20: Present * 30: Nett |
Example
{
  "project_group": 123,
  "filter": {},
  "ordering": {},
  "opts": {
    "matrices": [
      1,
      2
    ],
    "categories": [
      1
    ],
    "eval_types": [
      10,
      20,
      30
    ]
  }
}
Value at Risk Difference
/api/v1/reporting/var_diff
Value at Risk Difference report elements can be fetched by POSTing the filter options to the URL above.
Options
It is possible to specify the following options for the Value at Risk Difference report element:
| Name | Type | Required | Description |
|---|---|---|---|
| matrices | list | The ids of the matrices that should be used to create matrix elements. | |
| sort | string | One of accepted sort codes. Codes are: * "by_value": By Value * "by_abs_value": By Absolute Value * "by_type": By Type |
|
| eval_types | list | A list of accepted evaluation types. Codes are: * 10: Gross * 20: Present * 30: Nett |
Example
{
  "project_group": 123,
  "filter": {},
  "ordering": {},
  "opts": {
    "matrices": [
      1,
      2
    ],
    "eval_types": [
      10,
      20,
      30
    ]
  }
}
Text Field
/api/v1/reporting/text_field
Text Field report elements can be fetched by POSTing the filter options to the URL above.
Options
It is possible to specify the following options for the Text Field report element:
| Name | Type | Required | Description |
|---|---|---|---|
| text_header | string | A user defined header / title. | |
| text_field | string | User defined text for the element. |
Default filter
If no filter is provided for the following values, these settings are used.
Fields not mentioned in table below, just default to false/none/empty/nothing.
| Name | Type | Default |
|---|---|---|
| eval_types | integer | 20: Present |
| verbosity_level | integer | 1: Limiting |
| control_apply_risk_filter | boolean | true |